The EasyLanguage ABCs: Next Steps in Mastering TradeStation Programming
Take the next steps in mastering TradeStation and EasyLanguage programming for free. We will cover more of the basics and start with strategy programming.
9 articles tagged “EasyLanguage”.
Take the next steps in mastering TradeStation and EasyLanguage programming for free. We will cover more of the basics and start with strategy programming.
Take the first steps in mastering TradeStation programming. We will cover some of the basic syntax elements, good coding habits and more.
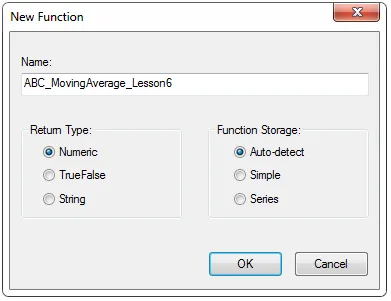
Learn to create and call functions in MultiCharts and TradeStation. Lesson 06 of the tutorial shows you how functions work and when to use them.
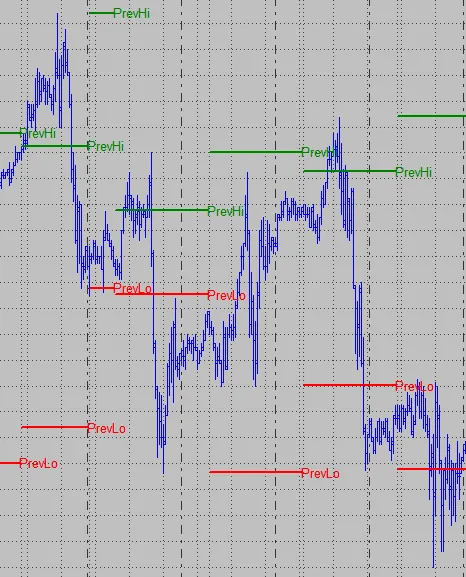
Learn how to use text and trendlines in MultiCharts and TradeStation. Lesson 05 of the tutorial takes a look at text and trendlines in EasyLanguage.
Lesson 04 takes a look at if statements and conditional branching. You will learn how to nest and group if statements and other conditional statements.
Lesson 03 introduces the while loop. You will learn the differences to a for loop and how to avoid issues that could arise when using a while loop.
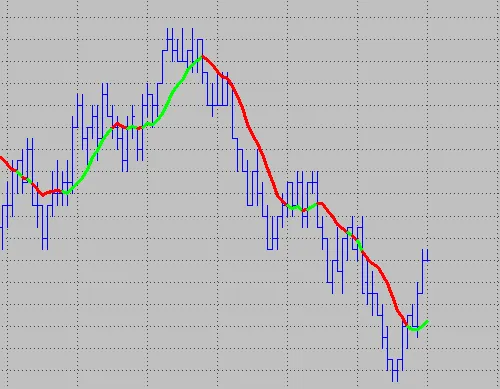
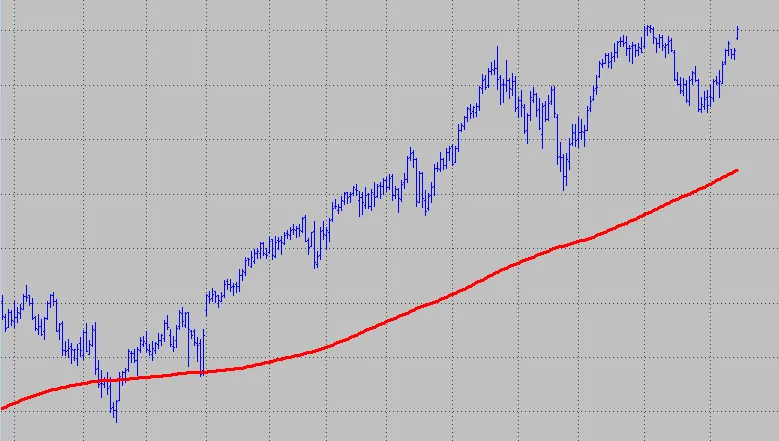
Lesson 02 shows you how to code a moving average. You will learn new code features like loops that help to create a flexible moving average solution.
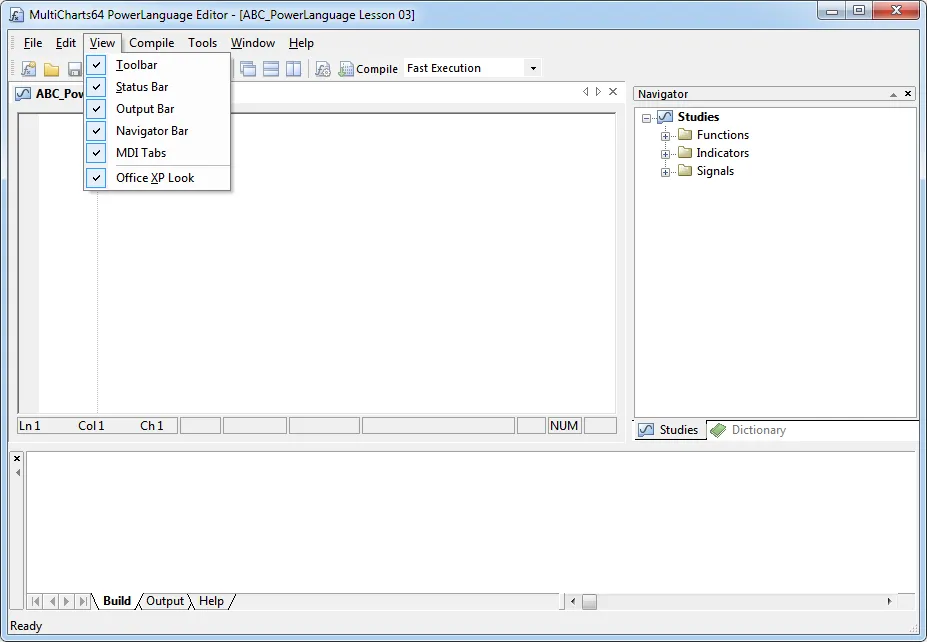
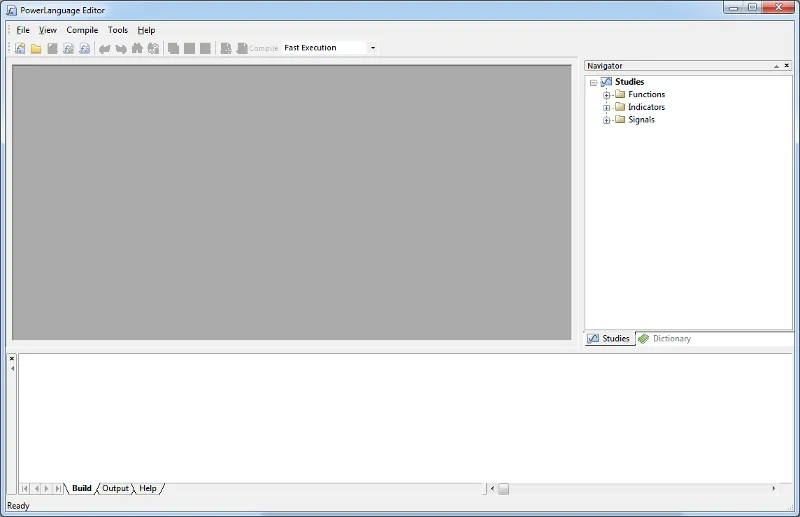
This EasyLanguage & PowerLanguage lesson helps you learn the programming language. Get to know the PowerLanguage Editor and the basics.
Our EasyLanguage tutorials help you learn the basics of EasyLanguage and PowerLanguage. Learn to write your own code with these EasyLanguage tutorials.