Tracking daily extremes with an indicator
The goal for this lesson is to do some more programming and create a study that tracks the daily extremes of a symbol. If you haven’t read the previous lessons, I suggest you start at the beginning with lesson 01, as this lesson uses basics covered in earlier sessions.
As I wrote, the goal is a study that can track the daily extremes and display them on the chart. We want to be able to see the current extremes for the day, and also show yesterday’s extremes on today’s data. Let’s take a moment to consider what we need for this study, and how we want to handle the objectives best:
- we need to be able to find the highest high and lowest low for each day
- the study should use trendlines to display yesterday’s extremes
- we want to be able to change the appearance on the chart via inputs
- the study should display text on the chart that labels the lines
This already gives you an idea of what we have to look at today. Besides being a useful study – or a framework for future modifications – drawing text and trendlines, and updating them, will be the focal point of this study.
MultiCharts and TradeStation provide functions that return the daily high and low, but for various reasons that is not what we want to use here. Instead, we’ll create two tracking variables that store the current highest high and lowest low. On a new day these variables need to be reset, and their values stored in a second set of variables. We need to do this to be able to track the new extremes and to draw the trendlines displaying yesterday’s values.
Simple Program Logic
We have outlined what the program should do. Let’s create a short list of the steps we need, for easier reference:
- track the daily high and low with a variable throughout the day
- store the previous daily extremes on a new day, and reset the tracking variables
- draw text and trendlines for the previous extremes on today’s data, and update them with every new bar
- add inputs to conveniently change the text and trendline looks (color, size, etc.)
This doesn’t look like too much work, so let’s start by creating a new indicator in the PowerLanguage editor. Give it a meaningful name, so you can find it easily later. I will start with the basic code for drawing text and trendlines, and I will make sure the code works in both MultiCharts and TradeStation. This means I will omit some reserved words for text and trendline manipulation that specifically MultiCharts offers – but we can look at these later, as they are not needed to produce the desired results here. Let’s take a look at the code for creating trendlines and text now.
Trendlines
Every trendline you create by code has a unique trendline-specific ID that you can use to modify the trendline later. You don’t have to worry about creating the IDs, as the software does that for you. The only thing we need to do is store the trendline ID in a variable, so we can retrieve it later in the code.
Trendlines are drawn using the reserved word “TL_New”, which is followed by six trendline parameters in brackets. When you want to draw a trendline – in real life or in programming code – you need at least two anchor points: a start point and an end point. However, you are not confined to keeping the trendline within these two points; you can extend it left and right to infinity.
Why does “TL_New” require six parameters? The six trendline parameters are needed to specify those two anchor points on a chart. On a chart, the location of every value can be described using three parameters – the date, the time, and the price of that value. As you need two anchor points, the “TL_New” reserved word therefore has six parameters.
TLID = TL_New(StartDate, StartTime, StartValue, EndDate, EndTime, EndValue);
“TLID” is a variable that holds the trendline-specific ID; the other six variables are properly named to show which parameter represents what. Let’s create a simple code drawing a trendline and look at the outcome on the chart. I put the trendline code within a once statement to make sure the code only creates one trendline.
Variables:
    TLID    (-1);  //TLID is initialized with -1 only for
                   //debugging reasons could be 0 or anything else

once
begin
    //draw a trendline spanning over eleven bars
    TLID = TL_New(Date[10], Time[10], Close, Date, Time, Close);
end;
This is what the above code draws on my chart. You need to go to the beginning of the chart, and you should find the trendline there. The color will probably be orange, as this is the default color the program uses, but don’t worry if you see a different color on your end.
With a couple of additional reserved words we are going to change the color, size, and style of the trendline. The first parameter for any of the reserved words that change a trendline is always the trendline-specific ID – otherwise the program wouldn’t know which trendline you want to change.
- TL_SetColor changes the trendline color.
- TL_SetSize changes the trendline width, from 0 to 6.
- TL_SetStyle sets the style according to the following list.
While it doesn’t matter whether you use the numbers or the reserved words like “Tool_Solid”, “Tool_Dashed”, and so on for changing the style, I will use the numbers during this lesson.
//draw a trendline spanning over eleven bars
TLID = TL_New(Date[10], Time[10], Close, Date, Time, Close);
    TL_SetColor(TLID, red);
    TL_SetSize(TLID, 2);
    TL_SetStyle(TLID, 2);
Adding the three reserved words and their parameters to the basic trendline code changes it to this. The code lines above produce this outcome, but please play around with the code a bit by modifying the color, size, and style of the trendline. Also try changing the start or end value to produce descending and ascending trendlines.
Text
Similar to trendlines, text needs an anchor point – but you only need one for text, instead of two for a trendline. Besides the three parameters for Date, Time, and Price of the text location, the “Text_New” reserved word has a fourth parameter for the text string that should be created on the chart. Another similarity is that every text object has a text-specific ID that you can use to alter the text appearance, its location, or the text string itself. In its basic form, the EasyLanguage code to create a new text object on a chart looks like this:
TxtID = Text_New(TextDate, TextTime, TextPrice, TextString);
Let’s add a simple text next to the basic trendline we created above.
Variables:
TxtID (-1),
TLID (-1); //TLID is initialized with -1 only for debugging reasons
//could be 0 or anything else
once
begin
//draw a trendline spanning over eleven bars
TLID = TL_New(Date[10], Time[10], Close, Date, Time, Close);
TL_SetColor(TLID, red);
TL_SetSize(TLID, 2);
TL_SetStyle(TLID, 2);
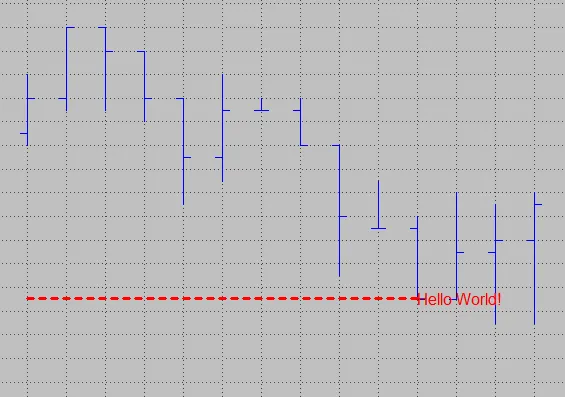
TxtID = Text_New(Date, Time, Close, "Hello World!");
end;
This is how it might look on your end. The first result is not very appealing, as the text is placed in the middle of the bar and therefore sits on top of the trendline.
Using some reserved words for text manipulation, we can change the outcome and enhance visibility. Besides changing the color and size, we can also change the text placement relative to the bar and the price it’s placed on. This is done using the reserved word “Text_SetStyle”, which has three parameters: the text-specific ID, and the horizontal and vertical placement of the text. The horizontal placement parameter can have three values:
- 0 – will place the text to the right of the bar
- 1 – will place the text to the left of the bar
- 2 – the text will be centered on the bar
The vertical placement parameter can have three different values, too:
- 0 – will place the text under the specified price value
- 1 – the text will be above the price value
- 2 – will center the text on the price
Adding the reserved words to change color, size, and style will alter the appearance and allow for a clearer outcome. When you are working in TradeStation, you will find that “Text_SetSize” is not supported. The study will work fine without it, though, so simply don’t include it in your code. The code below will align the text to the right of the trendline, change its color to red, and make it more visible by enlarging the text size.
Variables:
    VertTxtPl    (2),    // 0 - below the specified price value
                         // 1 - above the specified price value
                         // 2 - centered on the specified price value
    HorizTxtPl   (0),    // 0 - to the right of the specified bar,
                         // 1 - to the left of the specified bar
                         // 2 - centered on the specified bar
    TxtID        (-1),
    TLID         (-1); //TLID is initialized with -1 only for debugging reasons
                       //could be 0 or anything else

once
begin
    //draw a trendline spanning over eleven bars
    TLID = TL_New(Date[10], Time[10], Close, Date, Time, Close);
        TL_SetColor(TLID, red);
        TL_SetSize(TLID, 1);
        TL_SetStyle(TLID, 1);

    TxtID = Text_New(Date, Time, Close, "Hello World!");
        Text_SetColor(TxtID, red);
        Text_SetSize(TxtID, 12);
        Text_SetStyle(TxtID, HorizTxtPl, VertTxtPl);
end;
Creating the indicator
Now that we know how to properly format text and trendlines on a chart, we can go back to building the indicator that tracks the daily extremes. According to the logic outlined above, we need to be able to find the highest high and lowest low on the chart. A neat way of doing this is using two variables that are updated whenever the chart makes a new high or low. The trick is that, on declaration and reset, we simply set the value of the variable to the “High” and “Low” of the bar. For the reset part we use a simple “if…then begin…end” statement. The evaluation condition becomes true when the date on this bar is different from the date on the previous bar – which is the case for the first bar of each day.
Variables:
    DayHigh    (High),
    DayLow     (Low);

//reset on a date change
if Date <> Date[1] then
begin
    //set the tracking variables to
    //the high and low of the first bar
    //of the day
    DayHigh = High;
    DayLow = Low;
end;

//update the variable tracking the highest high
if High > DayHigh then
    DayHigh = High;

//update the variable tracking the lowest low
if Low < DayLow then
    DayLow = Low;

//plot variables on the chart
Plot1(DayHigh, "DayHigh");
Plot2(DayLow, "DayLow");
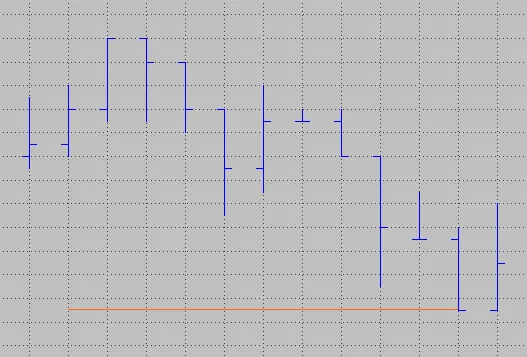
When a new bar comes in with a “High” that is higher than the value of “DayHigh”, the “DayHigh” variable is updated with the new value. This way we can easily track the highest high and lowest low as the day develops. Adding two plots to output the values of the two tracking variables will show whether the code works as intended.
![]()
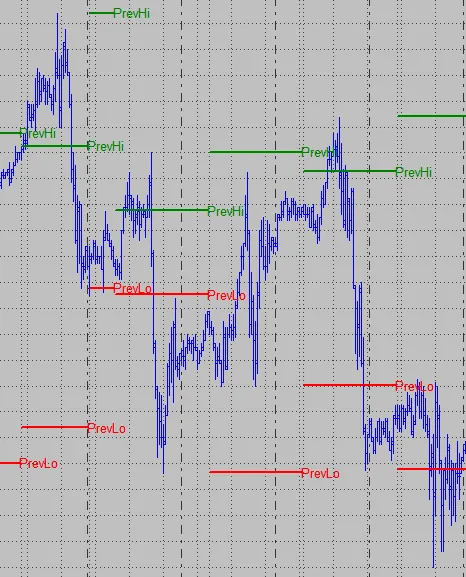
According to the above image, the daily tracking seems to work fine. Let’s finish this study by removing the plots and creating two trendlines that display the previous daily extremes on today’s data. On top of that, we want to create two text objects that label the two trendlines and align them properly on the chart.
I have created a couple of inputs that can be used to change the text and trendline appearance on a chart. This way the outcome is easier to alter, and you don’t always have to make changes in the code directly. We will simply reference the inputs later in the code when we create the text and trendlines. Besides the variables we have used before, and that you already know, I have added four variables for the text and trendline IDs, plus two variables named “PrevDayHigh” and “PrevDayLow” that store the value of the daily extreme tracking variables before they are reset. The names I used are arbitrary and you can use different ones, of course. The boolean variable “HaveTextAndLines” is used in the code to check whether there is at least one set of text and trendlines present on the chart. It is set to true with the first date change, which is also the point when the first trendlines and text are created.
Inputs:
    HighTLColor     (darkgreen),
    LowTLColor      (red),
    TLSize          (1),
    TLStyle         (1),
    HighTextColor   (darkgreen),
    LowTextColor    (red),
    TextSize        (10);

Variables:
    VertTxtPl        (2),    // 0 - below the specified price value
                             // 1 - above the specified price value
                             // 2 - centered on the specified price value
    HorizTxtPl       (0),    // 0 - to the right of the specified bar,
                             // 1 - to the left of the specified bar
                             // 2 - centered on the specified bar
    HaveTextAndLines (false),
    DayHigh          (High),
    DayLow           (Low),
    PrevDayHigh      (0),
    PrevDayLow       (0),
    HiTxt            (-1),
    LoTxt            (-1),
    HiTL             (-1),
    LoTL             (-1);
Having the inputs and variables in place, we can start with the reset condition part. When the reset condition becomes true on the first bar of every day, we need to store yesterday’s tracking variables into “PrevDayHigh” and “PrevDayLow”, so we can use these for our trendlines. The code sets the boolean “HaveTextAndLines” to true and creates two trendlines and two text objects using the inputs from above. Each text and trendline has its own specific ID that we can use later in the code to update the endpoints and location for the current bar.
//reset on a date change
if Date <> Date[1] then
begin
    //save previous day's extremes before resetting them
    PrevDayHigh = DayHigh;
    PrevDayLow = DayLow;

    //set the tracking variables to
    //the high and low of the first bar
    //of the day
    DayHigh = High;
    DayLow = Low;

    //this boolean variable is used to make sure that the trendlines
    //and text exist, later in the code
    HaveTextAndLines = true;

    //create new trendlines to display previous extremes; we will start
    //drawing the trendline with the values for the current bar and
    //update them with every new bar in the code
    HiTL = TL_New(Date, Time, PrevDayHigh, Date, Time, PrevDayHigh);
        TL_SetColor(HiTL, HighTLColor);
        TL_SetSize(HiTL, TLSize);
        TL_SetStyle(HiTL, TLStyle);

    LoTL = TL_New(Date, Time, PrevDayLow, Date, Time, PrevDayLow);
        TL_SetColor(LoTL, LowTLColor);
        TL_SetSize(LoTL, TLSize);
        TL_SetStyle(LoTL, TLStyle);

    HiTxt = Text_New(Date, Time, PrevDayHigh, "PrevHi");
        Text_SetColor(HiTxt, HighTextColor);
        Text_SetSize(HiTxt, TextSize);
        Text_SetStyle(HiTxt, HorizTxtPl, VertTxtPl);

    LoTxt = Text_New(Date, Time, PrevDayLow, "PrevLo");
        Text_SetColor(LoTxt, LowTextColor);
        Text_SetSize(LoTxt, TextSize);
        Text_SetStyle(LoTxt, HorizTxtPl, VertTxtPl);
end;
The final code part handles the daily extreme tracking and the updating of the text location and trendline endpoints. Updating the trendline endpoint is done via “TL_SetEnd”. This reserved word has four inputs: the trendline-specific ID you want to update, followed by the date, time, and price for the endpoint.
TL_SetEnd(TLID, TL_End_Date, TL_End_Time, TL_End_Price);
The new text location is set via “Text_SetLocation”. This reserved word comes with four parameters, too. The first is the text-specific ID. The remaining three are the date and time of the bar where you want to place the text, and the price where the text should be located.
Text_SetLocation(TextID, Text_Bar_Date, Text_Bar_Time, Text_Bar_Price);
We use the boolean variable “HaveTextAndLines” to make sure we only try to update a text or trendline when it’s certain that at least one set of text and trendlines exists. Trying to update non-existing text or trendlines might create problems, so it’s better to create a safety net here.
//to prevent errors we only update trendlines when we are sure that
//at least one set of trendlines exist
if HaveTextAndLines then
begin
    //update the trendline endpoints
    TL_SetEnd(HiTL, Date, Time, PrevDayHigh);
    TL_SetEnd(LoTL, Date, Time, PrevDayLow);

    //update text to the new location
    Text_SetLocation(HiTxt, Date, Time, PrevDayHigh);
    Text_SetLocation(LoTxt, Date, Time, PrevDayLow);
end;

//update the variable tracking the highest high
if High > DayHigh then
    DayHigh = High;

//update the variable tracking the lowest low
if Low < DayLow then
    DayLow = Low;
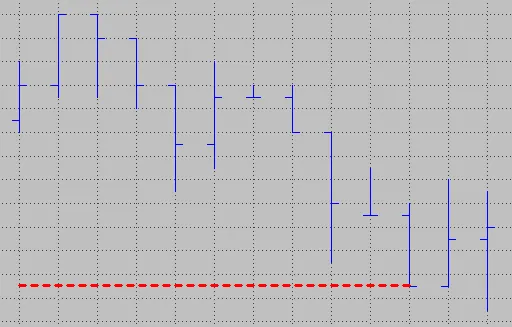
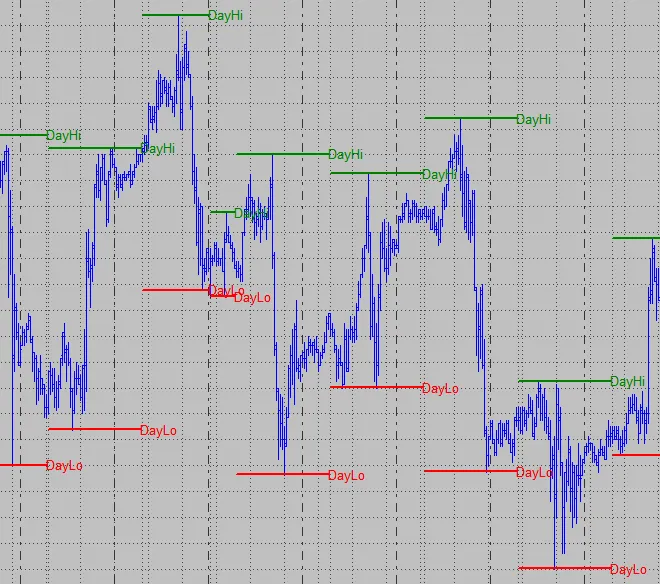
Let’s check whether the code is doing what we intended. Load the indicator onto a chart and check that you see two trendlines and text objects for every day (except the first day on the chart), correctly displaying the previous day’s extremes.
Conclusion and homework
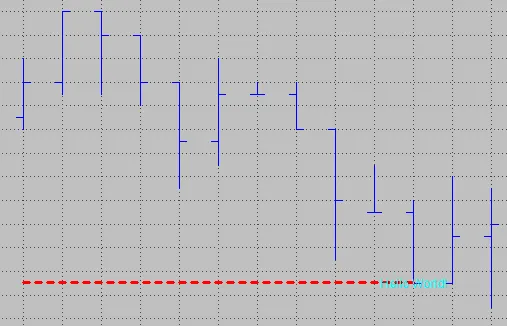
According to the image above, the code seems to do what we had in mind. There are two trendlines and text objects for every day, and they correctly display the previous day’s extremes. This concludes this lesson about text and trendlines, and I hope you enjoyed it and learned something you can use in your own programming.
As an addition to this lesson, and as a good exercise, change this code so that the current daily extreme is displayed properly with the text and trendlines. As a tip, you’ll have to use the “TL_SetBegin” reserved word for this. It works similarly to the “TL_SetEnd” reserved word, only that you specify the trendline start point with it. Another tip: you might need to store the start date and time for the current day’s trendlines in variables. You also need to change some positions within the code, so the text and trendlines use the proper value for the extremes and don’t suffer from a one-bar delay. The result of the changes might look something like this.
If you are having trouble getting the modifications to work, you can send me your code and I will give you a hint. As always, I am looking forward to feedback or impressions of the indicators you created. See you in the next lesson.