


Tick-data volume profiles with automated node detection
Multi-year profiles in under a second
- Problem
- Loading raw ticks into charts slowed profile generation and reduced usability for long-term volume-at-price analysis.
- Solution
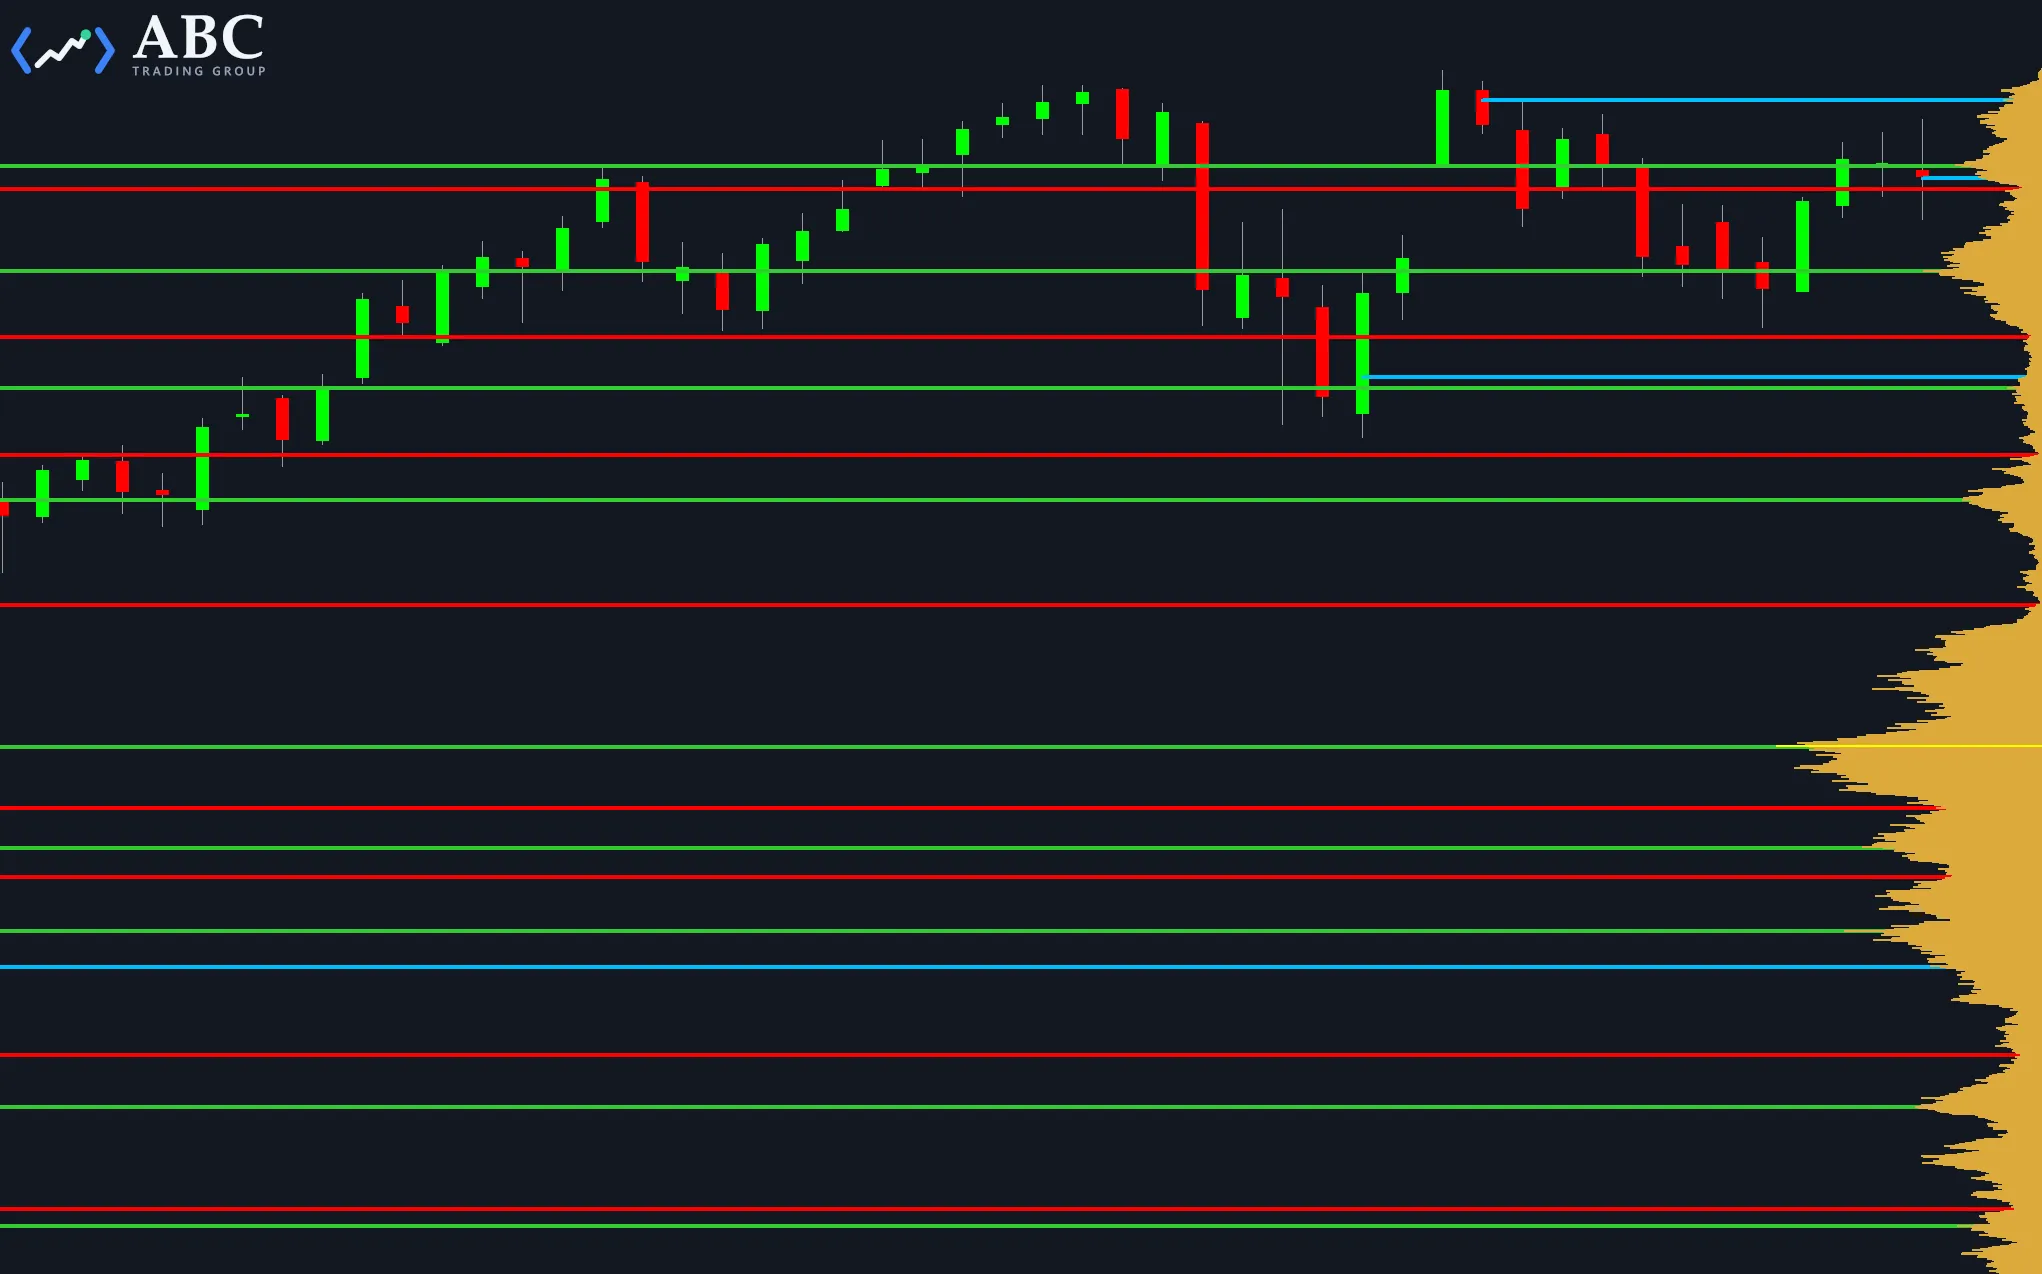
- A PowerLanguage indicator that converts incoming ticks into long-term volume-at-price profiles using an external database/cache (text-file ingestion), so charts do not load raw ticks. It performs automated high/low volume-node detection, tracks virgin nodes, and issues configurable alerts as price approaches a node.
- Outcome
- The desk reported more consistent volume-profile signals and clearer support/resistance levels with fewer false signals.
- Deliverables
- PowerLanguage indicator, external database/cache schema, deployment guide, sample workspace, alert examples.
 Read the full case study