
Learn how to properly use the while loop in your programming
Welcome back for the next lesson on our way to becoming fluent in MultiCharts, EasyLanguage, and PowerLanguage. If you haven’t read the previous lessons yet, I would suggest starting here. Each new lesson builds on the previous ones, and starting at the beginning will ensure you have a solid foundation.
Lesson 02 showed how you can easily calculate a simple moving average and plot it on the chart. We used a “for loop” to sum the values over the previous bars that make up the average. Today you will learn another type of loop, and how to use the editor to print information to the output bar.
Setting up the Output Bar
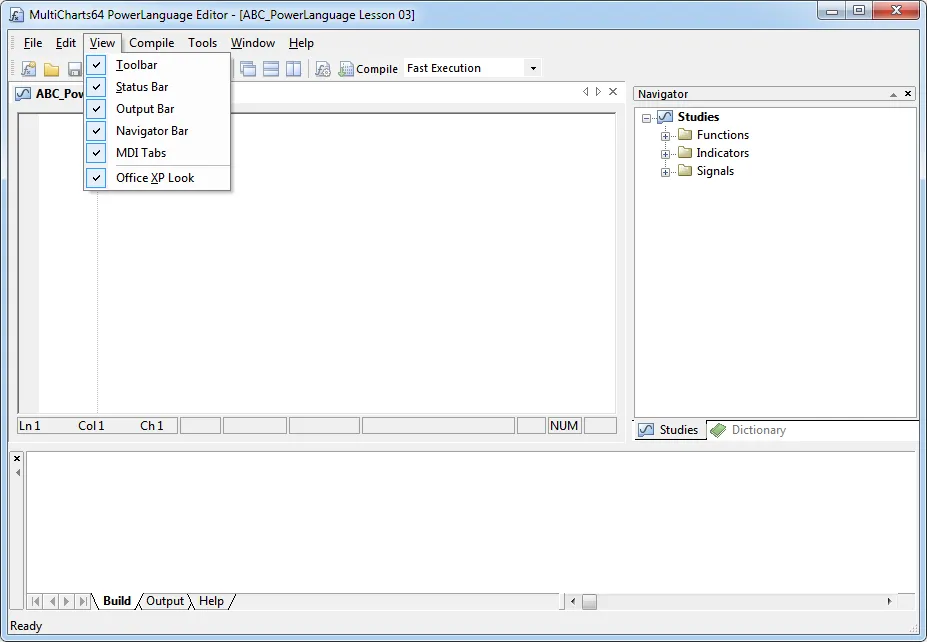
In the first lesson we looked at the main window within the PowerLanguage editor. When you open the editor it will probably show three different parts, as shown above. If it looks very different on your end, chances are you changed the appearance under “View”. Make sure that the “Output Bar” is checked, as we will use it during this lesson.
Switch to the “Output” tab in the bottom window. This is where the PL editor displays information coming from print statements within your code. We will take a look at how this works now. Create a new indicator with a name of your choice – again, I use a name that is easy for me to find within the editor and that describes the purpose of the indicator. We want the print statement to appear only once in this demonstration. EasyLanguage offers a convenient reserved word for pieces of code you want executed once only.
once
    Print("I am a print statement and I will appear in the Output tab.");
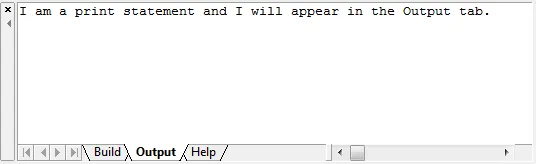
Applying an indicator with this statement only will produce this result in the Output tab. Removing the reserved word “once” would make the indicator print once for every historical bar on the chart, and once with every incoming realtime tick.
Introducing the while loop
In the previous session the “for loop” came in handy to allow for a flexible moving average calculation. We could achieve the exact same result with another type of loop offered by EasyLanguage. You might ask why you’d need another type, but each type has its strength and sometimes one is better suited than the other.
The type we want to familiarize ourselves with today is the “while loop”. It will repeat a code statement while a condition to be evaluated is true. An example of a while loop could look like this:
Variables:
    ii    (0);

//for this demonstration I want the code to be executed only once
//therefore I placed it within a once begin ... end; conditional branching
once
begin
    ii = 0;

    while ii < 10
    begin
        //as long as ii is below 10 execute the following statements

        //print the current value of ii to the output bar
        Print("Current value of ii = ", NumToStr(ii, 0));

        //increment the value of ii by one each time the iteration is executed
        ii = ii + 1;
    end;
end;
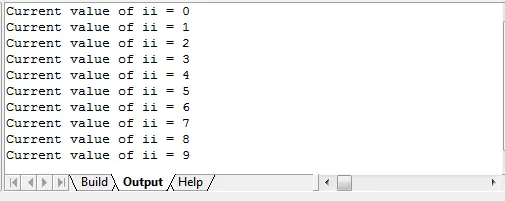
From the code you can see that the while loop will be executed until “ii” reaches a value of ten. When ii = 9 the statements within the loop are executed for the last time, and ii is incremented to ten. When the code jumps back to the beginning and checks the condition ii < 10, this is no longer true (as ii = 10), and therefore the loop will not be executed again. As ii starts at 0, and the statements within the loop get executed while ii < 10, we should expect ten print statements in our Output tab.
The danger of infinite loops
Recall that the “for loop” automatically increments (or decrements) the counter variable and stops when the ending value for the counter is reached. The while loop is different here, as you have to take care of the counter variable via code yourself.
If you forget to take care of the counter variable, or of the condition that is evaluated in the first line of the loop, you create a so-called “infinite loop”. Infinite, because the loop will never be exited and therefore the code calculation would never finish. This is a sure way to crash MultiCharts, so make sure to always add a check to prevent that.
Let’s look at how an infinite loop would look, and how you can add some code to prevent it from crashing your program. The next three examples have in common that their evaluation condition will never be true, so they create an infinite loop. I would not recommend executing this code in MultiCharts unless you are keen on making it crash. When you work in TradeStation, the software by default has protection against infinite loops enabled. This means it won’t crash, but will raise a warning message and stop the code calculation.
ii = 0;

while ii < 10
begin
    //as long as ii is below 10 execute the following statements

    //print the current value of ii to the output bar
    Print("Current value of ii = ", NumToStr(ii, 0));

    //increment the value of ii by one each time the iteration is executed
    ii = ii - 1;
end;

kk = 0;

while kk = 0
begin
    //print the current value of ii to the output bar
    Print("Current value of kk = ", NumToStr(kk, 0));
end;

ThisCondition = true;

while ThisCondition = true
begin
    //print this statement to the output bar
    Print("Hello World!");
end;
Let’s take a closer look at each example and see why it results in an infinite loop:
- The first loop is executed as long as “ii” is lower than ten. It starts with “ii” being zero, as it’s reset before the loop begins. With every loop cycle “ii” is decremented – i.e. every cycle subtracts one from the value of “ii”. After the first cycle “ii” is -1, then -2 after the next cycle, and so on. As you can see, this would never reach a value of +10.
- The second example is executed as long as “kk” is equal to zero. As the value for “kk” is not changed during the loop, it stays at zero, and so the cycle is never stopped.
- The last example uses a boolean (true/false) expression to check whether the loop should stop or continue. As long as “ThisCondition” remains true, it will keep cycling once it’s entered. In this example “ThisCondition” is never set to false within the loop code, so the result is another infinite loop and a crash of MultiCharts.
How to prevent a crash
To prevent a loop from crashing MultiCharts, you can either make sure the evaluation condition becomes true at some point during the loop, or you can use PowerLanguage to force the loop to stop. With the reserved word “break”, a loop is immediately terminated and the code resumes after the loop.
This can be used together with a variable that tracks the cycles and breaks the loop after a certain number of cycles. I like to use this way of breaking loops on top of the regular evaluation-condition ending, as it offers additional protection. When writing code, this is a lot less trouble than having MultiCharts crash all the time when there is a bug. It can also help in debugging your code, when you print the current counter variables to the output bar at the moment you force the loop to break. The next examples show how easily you can break or stop the loop by setting a boolean expression to false.
ThisCondition = true;
LoopCounter = 0; //a counter variable that is used to track the loop cycles

while ThisCondition = true
begin
    //print this statement to the output bar
    Print("Hello World!");

    LoopCounter += 1; //this is the same as: LoopCounter = LoopCounter + 1;

    if LoopCounter > 10 then
        ThisCondition = false;
end;
The code above shows a loop using a boolean evaluation condition that is set to “false” after a number of loop cycles. Instead of setting “ThisCondition” to false, you could use the reserved word “break” to immediately exit the loop, too.
ThisCondition = true;
LoopCounter = 0; //a counter variable that is used to track the loop cycles

while ThisCondition = true
begin
    //print this statement to the output bar
    Print("Hello World!");

    LoopCounter += 1; //this is the same as: LoopCounter = LoopCounter + 1;

    if LoopCounter > 10 then
        break;
end;
One thing to remember when using “break” is that every code expression within the loop that comes after the break command will not be executed anymore. Setting “ThisCondition” to false instead lets the loop continue until the next time it starts over with the evaluation expression. If you try the next example out, you will see that the text after the “break” command never appears in the PowerLanguage Output bar. The reason is that the loop is exited with the break command.
once
begin
    ii = 0;

    while ii < 10
    begin
        //increment the counter
        ii = ii + 1;

        Print("ii: ", ii:0:0);

        if ii > 5 then
        begin
            break;
            Print("I will never be printed.");
        end;
    end;
end;
Our first infinite loop example can be fixed by adding a break command, instead of making sure the counter variable gets incremented. Of course, it would be better coding practice to make sure the counter works correctly in the first place – either make sure it gets incremented, or check for the counter variable being greater than “-10”.
ii = 0;
LoopCounter = 0; //a counter variable that is used to track the loop cycles

while ii < 10
begin
    //as long as ii is below 10 execute the following statements

    //print the current value of ii to the output bar
    Print("Current value of ii = ", NumToStr(ii, 0));

    //increment the value of ii by one each time the iteration is executed
    ii = ii - 1;

    LoopCounter = LoopCounter + 1; //this is the same as: LoopCounter += 1;

    if LoopCounter > 10 then
        break;
end;
Homework: rewrite the moving average with a while loop
This should give you a better understanding of the while loop and how to use it while avoiding a MultiCharts crash caused by infinite loops. To end the lesson, let’s rewrite the moving average code from Lesson 02 by replacing the “for loop” with a “while loop”.
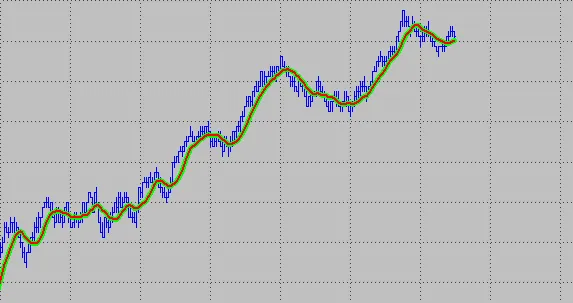
To give you a better learning experience – and to see whether you took something away from this lesson – you should give it a try. If you compare both averages, the one from lesson 2 and the modification with the “while loop”, they should be identical if you use the same inputs. That can help you find any issues. Another hint: use the Output bar with the print command when you run into problems or differences. If you really get stuck, you can contact me with your code changes and I will help by pointing you in the right direction. The image shows an identical result using a “for loop” (green average) and a “while loop” (red average).