

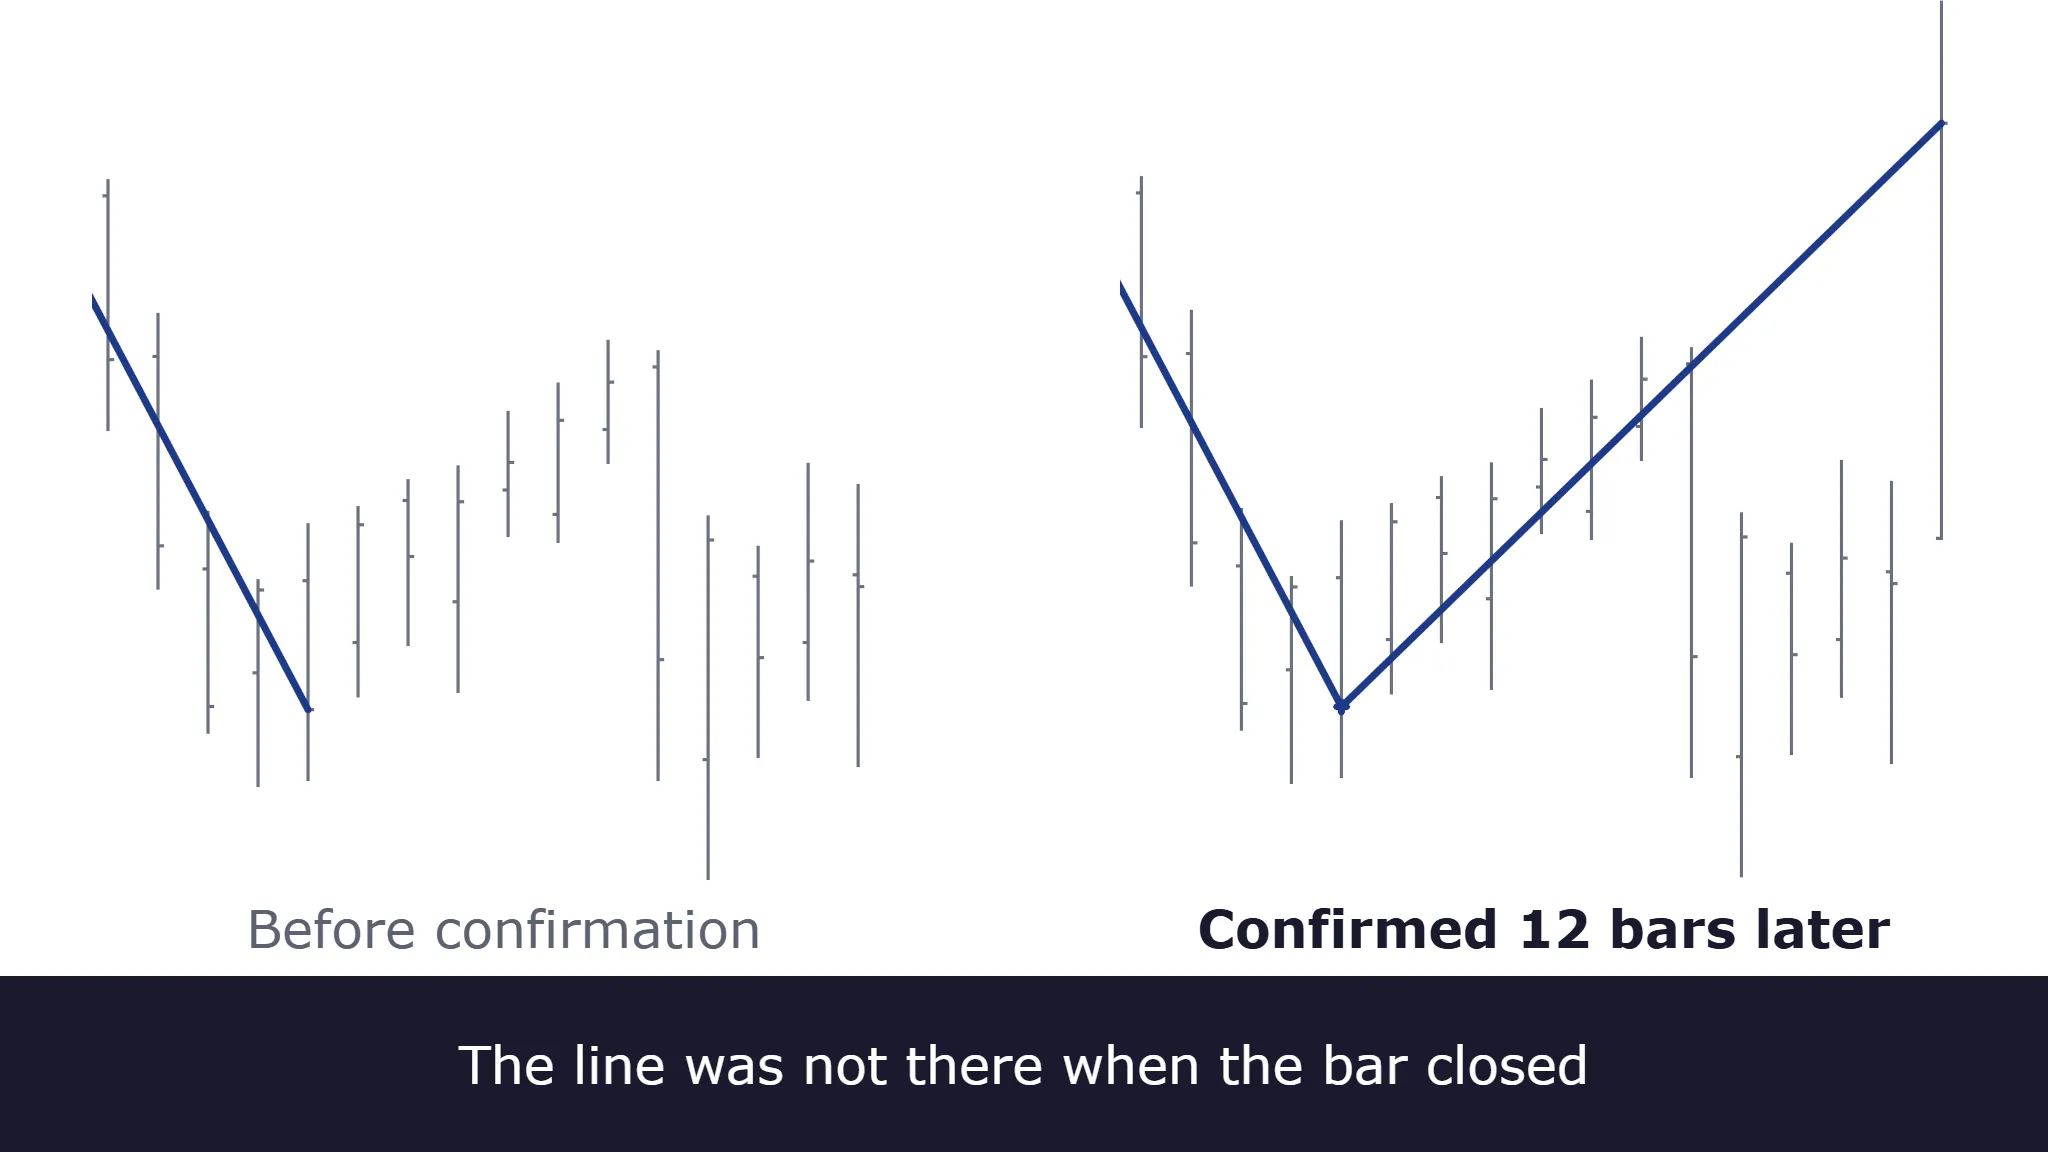
An indicator repaints when the chart you look at today is not the chart you would have seen at the time. The signal sits exactly where you wish it had been: at the top, at the bottom, one bar before the move. It looks like an edge. It is hindsight with a timestamp.
Repainting is a recurring reason a strategy that backtests beautifully falls apart in live trading, and it is unusually hard to catch, because nothing breaks. The code compiles, the backtest runs, the chart looks better than ever.
Key takeaways
- An indicator that updates on every tick recalculates the bar that hasn’t closed yet. That is normal. Repainting means a value on a closed bar changed after the fact.
- The usual examples are pivot-style tools (ZigZag, fractals, swing highs, supply and demand zones). A turning point can only be confirmed some bars after it happens, and that delay is the rule working rather than a defect.
- One test settles it: compute the indicator on data up to bar N, then recompute with more data. If the value at bar N changed, it repaints.
- Repainting doesn’t have to be removed. It has to be separated from the decision, so the drawing can look back while the signal never does.
- Plenty of honest strategies win often. A backtest with no losing trades at all is a different animal, and hindsight is the first explanation to rule out.
Jump to: What repainting means · Five kinds · What it costs · Three tests · How to fix it · Why AI code repaints
What repainting actually means
Start with what repainting is not, because the term gets stretched to cover things that are not defects at all.
An indicator set to update on every tick recalculates while the current bar is forming. A 20-period moving average moves with every tick until the bar closes. An RSI value wobbles all session. That is not repainting; it is the indicator correctly reporting an unfinished bar. Set the same indicator to update on bar close and the movement disappears, which tells you this is a calculation setting rather than a property of the indicator.
Acting on that moving value is not a defect either. Intrabar strategies do it deliberately, and platforms support it directly: TradeStation and MultiCharts call it intrabar order generation, and the others have their own equivalents. The question is never whether you act before the close. It is whether the record you tested against matches what you could actually see.
Repainting is a stricter thing:
An indicator repaints if a value it already printed on a closed bar changes later.
That is a testable definition, and it is the one to hold people to. Once a bar has closed, its history is fixed. Any indicator whose output on that bar keeps moving is telling you something it could not have told you at the time.
Five kinds of repainting
They are not equally bad, and lumping them together is why the topic generates so much confusion. Only one of the five is a defect under all circumstances.
| Kind | What happens | When it's a defect |
|---|---|---|
| Forming bar | Values move until the bar closes | Only if the test can't reproduce the intrabar path |
| Provisional pivots | The current leg moves until a counter-move fixes it | Only if the signal fires at the pivot instead of at confirmation |
| Higher-timeframe leakage | An unfinished higher-timeframe bar used as if complete | When the test reads a bar that hadn't closed at that point |
| Historical vs. real time | The indicator computes differently on past and live bars | Always |
| Future references | Code reads a future bar | For prices. Scheduled data is a separate case |
Two more belong on a complete list, and this article does not work through them. Data revisions repaint without any code changing: a vendor cleans a bad tick or backfills a gap, or you switch the session template or timezone, and historical values move underneath you. History-length dependence is quieter and more widespread: load more bars and a recursive indicator’s value on an already-closed bar shifts, because its seed moved with the start of the data. The log test below catches the first. For the second, vary how much history you load rather than how much you withhold.
The forming bar
Covered above. Normal and expected, and whether you act on it is a design choice rather than a correctness question. Worth naming so it stops being used to defend the other four: “all indicators repaint” is true only in this trivial sense.
Where it does turn into a correctness question is the test. A strategy meant to act inside the bar has to be tested against data that reproduces the path inside the bar, which is exactly what intrabar order generation and bar magnifier settings exist for. Test it against bar-close data instead and the backtest is measuring a different strategy from the one you intend to trade.
Provisional pivots
This is the classic, and it deserves the most attention because the logic is usually correct and still produces a fantasy.
Take a ZigZag with a 5% reversal threshold. While price keeps making new highs, the indicator extends its current leg to each new high, so the bar it points at moves as the extreme moves. Only once price has fallen 5% from that high does the leg stop and a new one start downward. From that point the pivot is confirmed and cannot change again. Implementations differ in exactly when they commit the drawing, but the shape is the same everywhere: a leg that walks forward, then freezes.
Three different things get filed under “repainting” here, and separating them is the whole point.
The delay is not a defect. A 5% reversal rule cannot confirm a high before price has fallen 5%. That is the rule doing exactly what it says, and no implementation can do better. Worth being blunt about, because the delay is the part most often called repainting, and it is the part that is simply arithmetic.
The moving leg is. A closed bar carries the pivot, and some bars later it does not. That is a value on a closed bar changing, which is the definition. It is also the least harmful of the three, because a strategy reading the indicator bar by bar watches the change happen instead of inheriting the result.
The chart is where it costs you. A historical chart shows the final pivots only. Nothing on it records which legs were provisional, how long each took to settle, or how many highs were marked and then unmarked along the way. The ZigZag looks prophetic, turning at every top and bottom, and it was never able to do that live.
The same pattern applies to fractals, swing-high and swing-low detectors, most supply and demand zone tools, Elliott wave labelers, and any “market structure” indicator that identifies a break after the fact. In each case the confirmation delay is not fixed. It depends on how fast price moves, which is exactly what you don’t know in advance.
Higher-timeframe leakage
Reference a daily value on an intraday chart and you have to be careful which daily value. Historically, the day’s close is sitting right there in the data. Live, you don’t get it until the session ends.
Code that reads “yesterday’s daily close” is fine. Code that reads “the daily close” while the day is still running is reading the future on every historical bar and something else entirely in real time. In Pine Script it is the classic misuse of a higher-timeframe request, where the historical series delivers the completed bar and live trading does not.
Referencing an in-progress higher-timeframe bar is not wrong in itself. “The day’s high so far” is a real quantity that you genuinely know at the time. The defect is the mismatch: a backtest that hands you the finished day while live trading hands you a partial one.
Historical versus real-time asymmetry
Here the code has no logical error at all. The environment differs.
Historical bars usually give an indicator only open, high, low, close, and volume. Real-time bars arrive as a stream of ticks. An indicator that reacts to the path within a bar sees a detailed path live and a four-point summary historically, so the two runs cannot agree.
For indicators in MultiCharts and TradeStation this is not a setting you can switch off. Historical bars are calculated once per bar, and the intrabar path is not available to an indicator after the fact. Any indicator whose output depends on the order in which price moved inside a bar will therefore behave differently the moment it goes live.
Strategies are where the platform gives you a lever. Intrabar order generation and bar magnifier let a backtest walk through finer data inside each bar, which closes much of the gap for entries, exits, and fills. That is a strategy-side facility, though. In MultiCharts and TradeStation it does not hand an indicator the tick path it never saw.
NinjaTrader is worth knowing about here. Its Tick Replay option rebuilds historical bars from tick data and replays the events as though they had arrived live, so an indicator written for it can see the intrabar path over history.
It comes with conditions, and they matter. The indicator has to be written for it: Tick Replay is not a switch that retrofits correctness onto code that was never designed to use it. It is turned on for the primary data series, and the option is hidden until you enable it in the platform’s settings. History reaches back only as far as your data provider supplies tick data. And it is expensive enough that the documentation recommends calculating on bar close where you can and loading no more data than you need. Where all of that lines up, though, the gap closes on the indicator side too.
Absent that, the result is an indicator that behaves impeccably in the backtest and differently, sometimes much worse, on the first live day.
Future references
The blunt version: code that reads a future bar’s price. A negative bar offset in EasyLanguage or PowerLanguage. A lookahead flag left on in a Pine Script higher-timeframe call. An array computed in one pass over the whole history and then indexed as though it had been built bar by bar. Where future price is concerned, this is straightforward look-ahead bias, and the code is simply wrong.
One distinction is worth drawing, though, because it usually gets flattened. Not everything carrying a future date is unknowable. Contract expiration and roll dates, session and holiday calendars, index rebalance effective dates, and a dividend that has already been declared are all genuinely known ahead of time, and a strategy is entitled to use them. The test is not whether a value sits in the future. It is whether you would have known it at the moment you needed it.
What repainting costs you
Numbers make this concrete, so here is a worked example on real data: front-month WTI crude, daily closes, February 2006 through July 2026, 5,271 bars. We ran a standard 5% ZigZag over it and recorded, for every pivot, both the bar where the pivot occurred and the bar where the rule actually confirmed it.
There were 424 pivots. The median one was confirmed 3 bars after it happened, the average 4.2 bars. Around 40% were confirmed within two bars, but 8% took ten bars or more, and the worst case took 24 bars: the high of $109.77 on February 24, 2012 was not confirmed until March 29, more than a calendar month later.
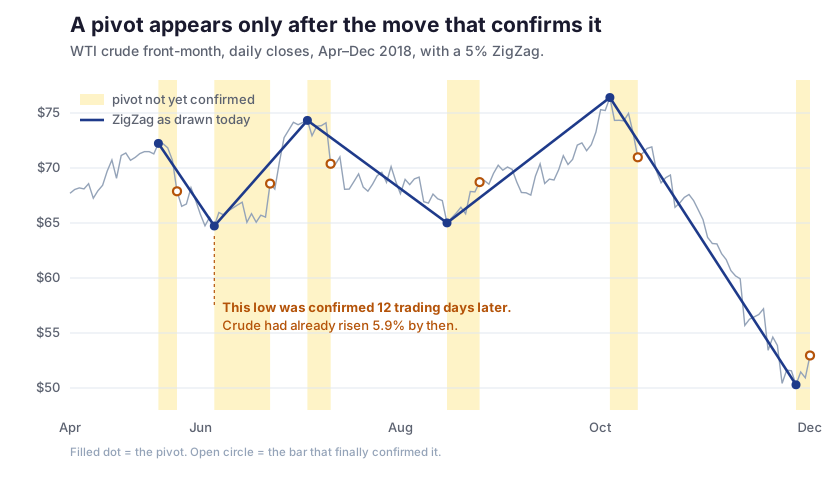
By the time a pivot was confirmed, price had already moved a median of 6.1% away from it. That is not a flaw in this particular implementation. It is arithmetic: a 5% reversal rule cannot confirm a turn until the turn is at least 5% old. The threshold is the minimum amount of the move you are guaranteed to miss.
Now put a strategy on top. Buy every ZigZag low, sell the next ZigZag high, long only, one barrel, no costs. Two ways to price the same 211 round turns:
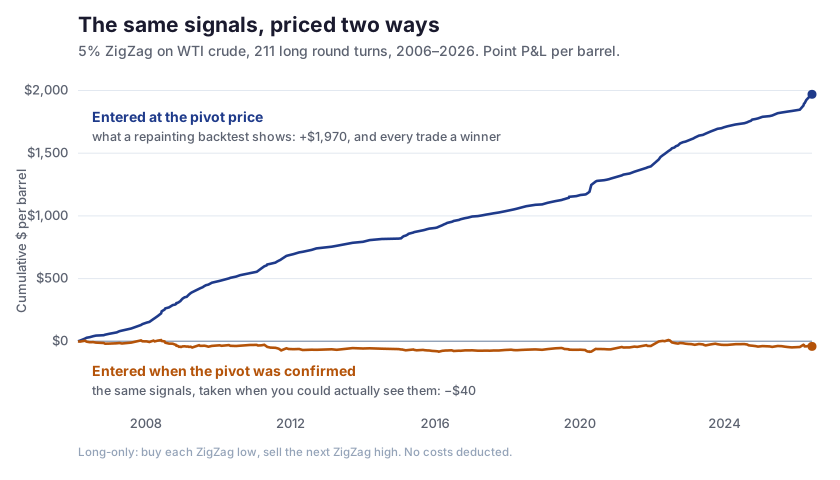
Filled at the pivot prices, the strategy makes $1,970 per barrel and wins 211 out of 211 trades. Filled at the close of the bar that actually confirmed each pivot, the identical signals lose $40 per barrel and win 37% of the time. The gap is about $2,010 per barrel, and commissions and slippage would push the honest version further down.
That 100% win rate is worth staring at. It is not a sign that the strategy is good. It is a structural consequence of pairing a low with a later high, and a backtest with no losing trades at all is usually describing its own construction rather than the market.
Be clear about what the upper curve is, though, because it is not what a platform backtest hands you by accident. In MultiCharts and TradeStation a strategy is evaluated bar by bar, so a rule referring to the pivot generally sees what the indicator knew at that bar. The perfect fills only come from code that reaches past what the indicator knew: a negative offset, or a whole-history array. That is look-ahead bias, not a subtle mistake.
The upper curve is what the chart appears to offer. Research code produces it too, whenever it computes pivots across an entire array and then indexes them as though they had arrived one at a time. So does the eye, when you scroll back through a chart and decide the setup was obvious. Those are the two places this actually costs money.
Three tests that settle it
You do not have to read the code to find out. Three tests, in increasing order of effort.
1. The truncation test
This is the definitive one, because it is the definition.
Run the indicator on data ending at bar N and record its value there. Then run it again on data ending at bar N + 50 and read the value at bar N a second time. If the two differ, the indicator repaints. Repeat at a few dozen scattered bars to be thorough.
The important detail is to truncate the data, not hide the bars. Filtering rows out of a chart while the underlying series still holds them proves nothing, because the indicator may still be reading the full array.
Run it in the other direction too. Keep the end fixed, change where the data starts, and read bar N again. A value that moves when you load more history depends on its own seed rather than reading the future, which is a different defect and takes a different fix.
2. The log test
Needs nothing but a print statement and works on any platform. Unlike the other two, it runs against the live feed rather than stored data.
Have the indicator write its own value, with a timestamp, to a file or the output window on every bar close in real time. Let it run for a few days. Then compare that log against what the same indicator shows for those bars now. Any disagreement is repainting, and this test catches the cases where the code is fine and the data feed or the bar-building is not.
3. The replay test
Run the strategy through the platform’s bar-by-bar playback and watch the signals appear. MultiCharts has Playback, NinjaTrader has Market Replay, TradingView has bar replay. This is the closest thing to seeing the indicator live without waiting.
Watch specifically for markers that appear on bars behind the current one. That is repainting happening in front of you.
Reading the code
If you have the source, a few patterns are worth searching for directly:
- Negative bar offsets, or any index that can resolve to a future bar
- Higher-timeframe or multi-data references without an explicit “use the completed bar” setting
- Branches that treat historical and real-time bars differently
- Whole-history passes that fill an array before the bar-by-bar logic runs
- Drawing objects placed at an offset back in time
How to fix it
The instinct is to delete the offending indicator. That is usually the wrong call, and it throws away a genuinely useful tool.
Separate the drawing from the decision. A ZigZag is an excellent way to see structure on a chart, and there is nothing wrong with using one in an entry rule, provided the rule refers to a pivot that has already been confirmed at the moment it fires. Most repainting problems dissolve once the visual layer is allowed to look backward as much as it likes while the signal layer never does.
In practice that means:
- Be deliberate about bar close versus intrabar. Either is legitimate. If the strategy is meant to act on completed bars, take the value of the completed bar and act on the next one. If it is meant to act inside the bar, keep that, and make sure the test reproduces the intrabar path rather than assuming it.
- Encode the confirmation delay explicitly. If a pivot needs a 5% reversal to be real, then the signal fires on the bar where that reversal completes, at that bar’s price, not at the pivot’s. The strategy still uses the pivot. It just stops pretending to have known about it early.
- Use only completed higher-timeframe bars. Yesterday’s daily close, not today’s in-progress one.
- Make historical and live behavior identical, and if the platform cannot do that with the data you have, treat the backtest as an estimate rather than a measurement.
- Re-run the backtest afterwards. This is the step people skip. If the edge only existed at the pivot price, the honest version will tell you immediately, which is the whole point of doing it.
Why AI-written code repaints so often
AI is a genuinely useful way to get a first draft of an indicator, and this section is not an argument against using it. But repainting is a blind spot for it, for reasons worth understanding.
Ask a model directly for a non-repainting indicator and you will usually get one. The constraint is not beyond it. The problem is that the constraint has to be stated, and repainting is the kind of thing you usually learn about after it has cost you.
From there it compounds:
- The natural reading of the request is the repainting one. Ask for “an indicator that marks swing highs and lows” and the direct implementation is the hindsight version. Nothing in the request says the answer has to be causal, and the constraint is rarely volunteered unprompted.
- The defaults are not on your side. Higher-timeframe calls, bar indexing conventions, and calculation modes all have defaults, and the safe choice is not always the default one.
- Widely shared community code repaints. Plenty of published indicators carry the defect, so code that looks canonical is not evidence of much.
- Nothing in the loop can catch it. Repainting produces no error, no warning, and no failing test. It shows up only in the gap between the backtest and live trading, and neither a chat session nor a clean compile can observe that gap. That last point is the one that matters, and it is not really about AI at all. Generated code needs exactly the verification that hand-written code needs. It just arrives faster, in far greater volume, and often without anyone having thought to ask whether it repaints. If you would rather have someone else run that check on your code, that is what our AI code review and strategy validation work is for.
A checklist before you trade it
- The value on a closed bar never changes when more data arrives
- Bar-close versus intrabar behavior is deliberate, and the test reproduces it
- Any confirmation delay is in the signal, not just in the drawing
- Higher-timeframe references use completed bars only
- Historical and real-time calculation produce the same output
- No negative bar offsets or future-resolving indices
- The backtest has been re-run with confirmation-time fills
- The win rate looks like a real strategy rather than a perfect one
The common thread
Repainting is not really a bug in an indicator. It is a claim about what you knew and when you knew it, and the chart is the last place that claim will ever be challenged.
The fix is rarely deletion. It is separation: let the drawing look backward, and make the signal earn its timestamp. A ZigZag that admits it needed twelve bars to see a low is far more useful than one that pretends it saw the low as it happened, because only the first one can be traded.
Our trading-system case studies include several multi-timeframe, swing-detection, and support-resistance tools. Separating the drawing from the decision is part of how we build them. The backtesting pitfalls that ruin trading strategies article covers the neighboring traps, from survivorship bias to the back-adjusted futures problem.
Frequently asked questions
Do all indicators repaint?
Only in the trivial sense that an indicator set to update on every tick recalculates the bar that has not closed yet, and even that stops if you set it to calculate on bar close. That is normal behavior rather than repainting. The meaningful question is whether a value on an already-closed bar changes later, and for a well-built indicator the answer is no.
Is repainting always bad?
No. A ZigZag or a market-structure tool that redraws is genuinely useful for reading a chart, and it can be used in a trading rule too. It becomes a problem when the rule acts as of the pivot rather than as of the bar that confirmed it, because the decision then depends on information that arrived after the fact.
How do I know if my indicator repaints?
Compute it on data up to a given bar, record the value, then recompute with more data added and read the same bar again. If the value changed, it repaints. Truncate the underlying data rather than merely hiding bars on the chart.
Why does my strategy work in the backtest but not live?
Repainting is a common cause, along with look-ahead bias, overfitting, and unrealistic fill assumptions. If the backtest shows almost no losing trades, or entries that consistently land near turning points, repainting is the first thing to check.
Does a non-repainting indicator lag?
Usually, yes, and that trade-off is unavoidable. Confirmation takes information, and information takes time. An indicator that identifies turning points without delay is not solving that problem; it is hiding it.
Can a repainting indicator be fixed?
Often, without changing what it draws. Keep the visual as it is and move the signal to the bar where confirmation actually completes. The strategy then trades the same structure at prices that were really available.
This post is for educational purposes and does not constitute investment advice. The strategy figures above are hypothetical illustrations of a calculation method, not a trading recommendation or a claim of results. See our risk disclaimer for the full statement on hypothetical and simulated performance.