


PowerLanguage

MultiCharts PowerLanguage Development

Custom PowerLanguage programming for production trading — strategies, indicators, optimization, backtesting, and live-deployment support. We turn strategy ideas into MultiCharts-ready systems with clean, maintainable code and clear documentation.

MultiCharts

What we do

The most common MultiCharts projects clients bring us — from one-hour fixes to complete systems.

Strategy design & implementation

Specification, coding and deployment of automated strategies: entry/exit, money management, position sizing and trade filters.

Modular development

Reusable components that speed testing, reduce bugs and simplify updates, integrating cleanly with MultiCharts.

Custom indicators & visual studies

PaintBars, support/resistance areas, multi-timeframe indicators and on-chart tools for faster decisions.

Backtesting & optimization

Exhaustive historical testing, parameter sweeps, walk-forward validation and robustness checks in the MultiCharts backtester.

Code review & performance tuning

Refactor legacy scripts, remove repainting logic, and optimize loops and data handling to reduce CPU use and improve execution accuracy.

AI-generated code hardening

Review and harden AI-written PowerLanguage: fix repainting and look-ahead bias, correct order handling, add risk controls, and deliver tested, deployable code.

Broker & execution readiness

DOM / real-time feed checks, simulated/live replay, and checks for order types, fills and slippage handling.

Ongoing support & maintenance

Hourly support or retainer plans for updates, bug fixes and adapting strategies as market structure changes.

NDAs available on request.

What PowerLanguage looks like

A simple demonstration of a moving-average crossover. Production projects add documentation, input validation and a change log.

MA Cross Alert — PowerLanguage
Inputs:
    FastLength(10),
    SlowLength(50);

Variables:
    fastAvg(0),
    slowAvg(0);

fastAvg = Average(Close, FastLength);
slowAvg = Average(Close, SlowLength);

Plot1(fastAvg, "Fast MA");
Plot2(slowAvg, "Slow MA");

if fastAvg crosses over slowAvg then
    Alert("Fast MA crossed above the slow MA");

Why our MultiCharts work stands out

  • PowerLanguage specialists with hands-on trading experience.
  • Production reliability focus — defensive coding, robust error handling and clear versioning.
  • Configurable risk controls — position sizing, stop logic and real-world order management available on request.
  • Trader-focused deliverables — readable source code, clear setup guides and reproducible backtest reports.

Typical engagement

  1. Intake & objectives

    We hold an intake meeting to define instruments, timeframe and risk limits, and review any sample data or scripts you provide.

  2. Functional spec & estimate

    You receive a written scope with deliverables, milestones and an estimated range of hours, plus checkpoints and transparent time tracking.

  3. Development & review

    We implement the agreed specification in PowerLanguage and walk you through the results for approval.

  4. Validation (optional; recommended for strategies)

    We run in-sample / out-of-sample backtests, walk-forward tests and sensitivity analysis.

  5. Handover

    You receive the final PowerLanguage source code, documentation and test results.

  6. Deployment support (optional)

    We assist with broker checks, paper-trading runs and go-live readiness, with the option of ongoing support.

Projects are billed hourly; estimates follow scoping. We notify you upfront if work is likely to exceed the initial estimate.

Deliverables you receive

  • PowerLanguage source code with inline comments — stress-tested and validated in-house.
  • Deployment & user guide (PDF): input descriptions, setup instructions, MultiCharts version notes, and data-feed/broker settings.
  • Backtest report (optional): equity curve, drawdown, trade stats and a brief plain-English interpretation.
  • Walk-forward summaries where applicable.
  • Versioned release and change log.

Case studies

Anonymized examples of MultiCharts projects we have delivered.

Tick-data volume profiles with automated node detection

Profile build speed improved by an order of magnitude

Proprietary trading desk Development effort ≈80 hours

Problem
Loading raw ticks into charts slowed profile generation and reduced usability for long-horizon volume-at-price analysis.
Solution
A PowerLanguage indicator that converts incoming ticks into long-term volume-at-price profiles using an external database/cache (text-file ingestion), so charts do not load raw ticks. It performs automated high/low volume-node detection, tracks virgin nodes, and issues configurable alerts as price approaches a node. Fixed price buckets preserve liquidity structure from intraday to multi-week horizons.
Outcome
Faster, more consistent volume-profile signals; clearer support/resistance levels; fewer false signals.
Deliverables
PowerLanguage indicator, external database/cache schema, deployment guide, sample workspace, alert examples.
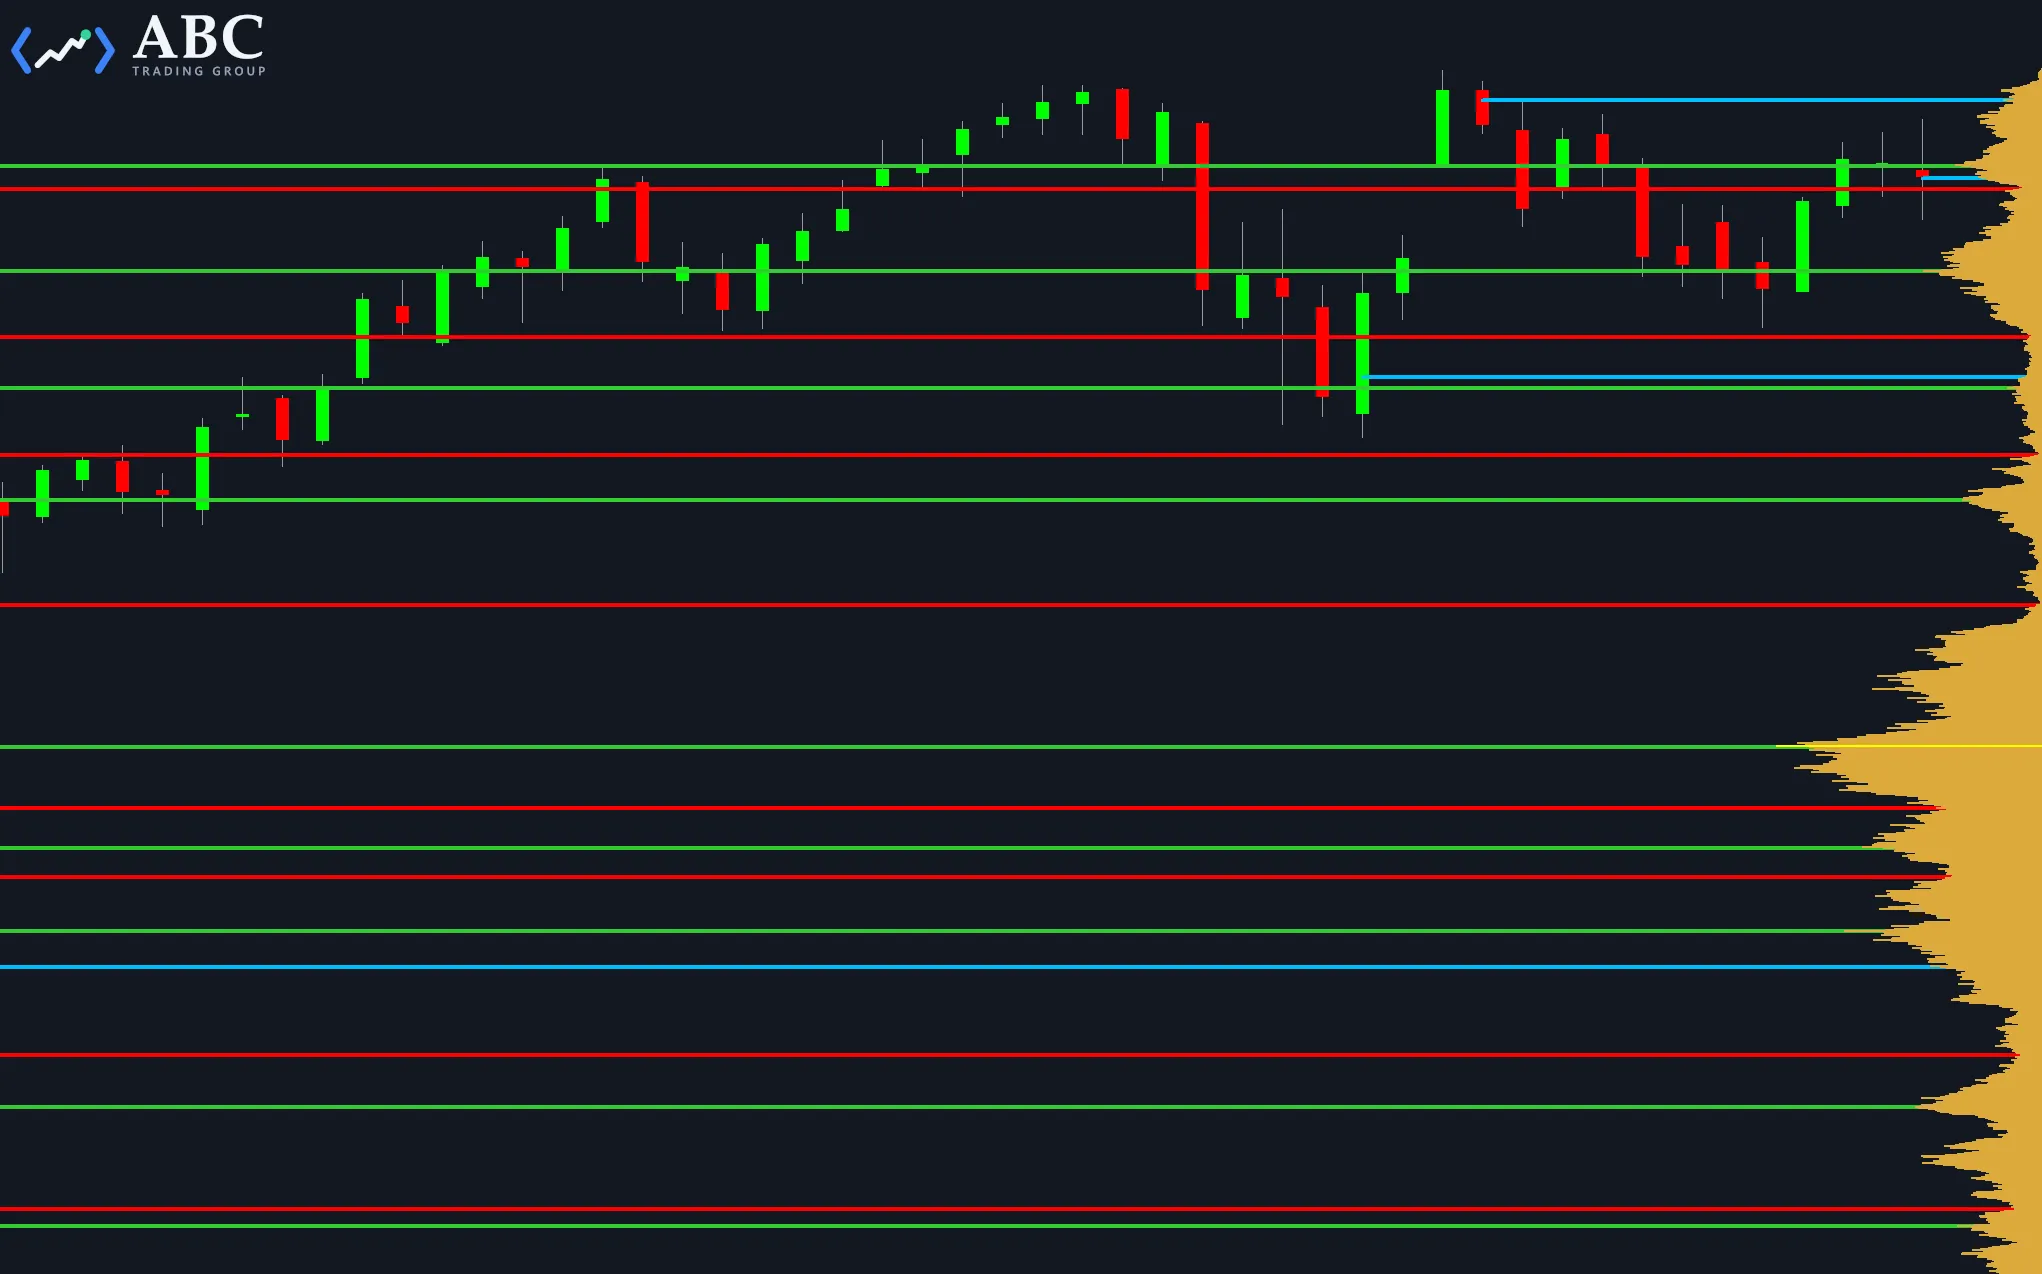
Dark MultiCharts candlestick chart where green, red and cyan horizontal lines mark automatically detected volume nodes across the price history, with an amber volume-at-price profile rising from the right edge.

Automated multi-strategy portfolio manager

Consolidated exposure control

CTA-style manager Development effort ≈100 hours

Problem
Multiple strategies across instruments and timeframes caused duplicated orders and incoherent exposure, and left conflicts to be resolved by hand.
Solution
A centralized portfolio controller in PowerLanguage that consolidates positions by underlying exposure, enforces max-exposure and per-strategy risk limits, queues and aggregates orders across instruments/timeframes (with netting to prevent duplicate fills), and provides P&L attribution and automated rebalancing. A simple risk-rules UI lets non-coders set limits and view current exposure.
Outcome
Controlled portfolio exposure, fewer execution conflicts, improved fills, and clearer performance attribution.
Deliverables
Portfolio controller, risk-rules UI, order-aggregation module, trade & risk logger.

Self-optimizing strategy

Lower operational overhead

Independent systematic trader Development effort ≈30 hours

Problem
Manual parameter tuning caused downtime.
Solution
A PowerLanguage strategy that runs parallel parameter searches and conservatively applies the best configurations live and in historical replay/backtests.
Outcome
An adaptive strategy with ongoing out-of-sample validation and reduced operational intervention.
Deliverables
Strategy code, deployment guide.

Custom resolution bar types

Lower-noise bars, clearer patterns

Futures trader Development effort ≈30 hours

Problem
Time bars masked price patterns.
Solution
Custom MultiCharts bar types (percent-range, volume-imbalance, dollar-volume) for indicators and backtests.
Outcome
Reduced noise and quicker pattern detection.
Deliverables
Bar modules, source code, integration notes.

MultiCharts ↔ Python/Excel integration

Access alternative data sources

Data-driven retail trader Development effort ≈20 hours

Problem
Proprietary/non-standard sources were hard to ingest.
Solution
A connector that normalizes web-scraped, API, and Excel data into MultiCharts for PowerLanguage.
Outcome
Expanded data access.
Deliverables
Python bridge, Excel templates, PowerLanguage receiver.

Harmonic pattern auto-trader

Consistent entries with automated risk management

Proprietary trading group Development effort ≈30 hours

Problem
Missed harmonic setups and slow manual entries.
Solution
Real-time pattern detection with auto-entry, stop placement, and partial exits.
Outcome
Consistent entries, automated risk management and backtestable setups.
Deliverables
Strategy code, deployment guide.

“Chris has been programming my ideas since 2009. He’s a brilliant programmer. I cannot imagine how my MultiCharts experience would have been if not for him and his programming. Thanks to him I was able to test many of my ideas which otherwise would have been impossible to test since I had no programming knowledge. His code is very straightforward, very easy to follow which allow us to learn a couple of things about EasyLanguage programming.

Thank you Chris for your services and I hope I continue to use them for many, many years.”

— Fernando S., Barreiro, Portugal

Pricing guide

Indicative ranges. Every project is quoted after scoping.

Indicators / visual studies

$500 – $1,200

Single strategy / custom bar types

$1,200 – $4,000

Modular systems / portfolio trader / self-optimizing strategies

$4,000+ (custom quote)

Projects are billed hourly. A final quote follows scoping and review of any existing code. Retainer and ongoing-support options are available and priced in proposals.

Frequently asked questions

What are typical timelines?

Simple indicators — days; strategies — 1–3 weeks; complex systems — 4–10+ weeks.

Can you work with existing code?

Yes. We routinely take over, rescue and improve PowerLanguage projects: diagnose issues, fix bugs, refactor for clarity and speed, extend functionality, and deliver tested, deployable code.

Can you fix code I generated with ChatGPT, Claude or another AI?

Yes — and you’re in good company; it’s one of our most common requests. AI tools are a quick way to prototype an idea, but the generated PowerLanguage code is often unsafe to trade as-is: typical issues include repainting, look-ahead bias that flatters backtests, fragile order handling and missing risk controls. We review the code against the rules you intended, fix what’s broken, harden it for live conditions and validate the result with proper testing. Send us the code and a short description of what it should do, and we’ll take it from there.

Which MultiCharts versions do you support?

We develop for current desktop releases and note version-specific caveats in deliverables.

Do I receive the source code?

Yes. Every project is delivered as documented, readable source code — not a compiled black box — together with usage instructions.

Do you guarantee profits?

No. You get reproducible testing, documented assumptions and deployment best practices — but no performance guarantees.

Is an NDA available?

Yes — available on request. Independent of any NDA, nothing you share is disclosed to a third party without your prior written consent.

Technical notes & best practices

  • Every delivery includes a PDF manual covering inputs, settings, usage and deployment steps, alongside inline code comments and a change log.
  • Backtests include reproducible scripts and data-range notes for independent verification.
  • Strategy code is written to prevent repainting and look-ahead bias, handle bar replay correctly, and document intrabar execution caveats.
  • Backtests state their Bar Magnifier and intrabar order-generation settings explicitly, so results are reproducible.
  • When a workload is too tick-heavy for chart-based studies, it can be moved outside the chart — as in the tick-data volume-profile project above, which builds profiles from an external cache.
  • Multi-data strategies are a known trouble spot in MultiCharts itself; we know the pitfalls, design around them where possible, and say so upfront when a simpler structure is the more robust choice.

Ready to turn your idea into working MultiCharts code?

Book a free 15-minute consultation to discuss scope, timeline and pricing. We respond within one business day — often the same day.