


.NET / C#

MultiCharts .NET Development

Custom MultiCharts .NET (C#) programming for production trading — strategies, indicators, optimization, backtesting, and live-deployment support. We build robust, object-oriented C# systems that integrate with MultiCharts .NET and third-party .NET libraries.

MultiCharts .NET

What we do

The most common MultiCharts .NET projects clients bring us — from one-hour fixes to complete systems.

Strategy design & implementation

C# implementation of automated strategies, money management, position sizing and trade filters.

Modular C# components

Clean, reusable code that makes updates faster and keeps systems reliable and easy to maintain.

Custom indicators & visual studies

Multi-timeframe indicators, on-chart widgets and high-performance calculation routines.

Backtesting & optimization

Exhaustive backtests, parameter sweeps, in-sample and out-of-sample testing, walk-forward validation and robustness checks.

Code review & performance tuning

Clean up and simplify existing code to reduce errors, speed execution and lower resource use for more reliable live trading.

AI-generated code hardening

Review and harden AI-written C#: fix event-driven logic and order management, remove look-ahead bias, add risk controls, and deliver tested, deployable code.

Broker & execution readiness

Integration testing with broker APIs, simulated/live runs, and order/fill validation.

Ongoing support & maintenance

Hourly support or retainer plans for updates, bug fixes and adapting strategies as market structure changes.

NDAs available on request.

What C# for MultiCharts .NET looks like

A simple demonstration of a moving-average crossover. Production projects add documentation, input validation and a change log.

MACrossAlert.cs — MultiCharts .NET
namespace PowerLanguage.Indicator
{
    [SameAsSymbol(true)]
    public class MACrossAlert : IndicatorObject
    {
        public MACrossAlert(object _ctx) : base(_ctx)
        {
            FastLength = 10;
            SlowLength = 50;
        }

        [Input]
        public int FastLength { get; set; }
        [Input]
        public int SlowLength { get; set; }

        private AverageFC fastAvg;
        private AverageFC slowAvg;

        protected override void Create()
        {
            fastAvg = new AverageFC(this);
            slowAvg = new AverageFC(this);
        }

        protected override void StartCalc()
        {
            fastAvg.price = Bars.Close;
            fastAvg.length = FastLength;
            slowAvg.price = Bars.Close;
            slowAvg.length = SlowLength;
        }

        protected override void CalcBar()
        {
            if (fastAvg.CrossesOver(slowAvg, ExecInfo.MaxBarsBack))
                Alerts.Alert("Fast MA crossed above the slow MA");
        }
    }
}

Why our MultiCharts .NET work stands out

  • MultiCharts .NET developers with hands-on trading experience.
  • Production reliability — defensive coding, error handling, automated checks and tracked code histories for safer updates and easier rollbacks.
  • Configurable risk controls — position sizing, stop logic and real-world order management available on request.
  • Trader-focused deliverables — readable source code, clear setup guides and reproducible backtest reports.

Typical engagement

  1. Intake & objectives

    We hold an intake meeting to define instruments, timeframe and risk limits, and review any sample data or scripts you provide.

  2. Functional spec & estimate

    You receive a written scope with deliverables, milestones and an estimated range of hours, plus checkpoints and transparent time tracking.

  3. Development & review

    We implement the agreed specification in .NET / C# and walk you through the results for approval.

  4. Validation (optional; recommended for strategies)

    We run in-sample / out-of-sample backtests, walk-forward tests and sensitivity analysis.

  5. Handover

    You receive the final .NET / C# source code, documentation and test results.

  6. Deployment support (optional)

    We assist with broker checks, paper-trading runs and go-live readiness, with the option of ongoing support.

Projects are billed hourly; estimates follow scoping. We notify you upfront if work is likely to exceed the initial estimate.

Deliverables you receive

  • MultiCharts .NET (C#) source code with inline comments — stress-tested and validated in-house.
  • Deployment & user guide (PDF): input descriptions, setup instructions, MultiCharts .NET version notes, and data-feed/broker settings.
  • Backtest report (optional): equity curve, drawdown, trade stats and a brief plain-English interpretation.
  • Walk-forward summaries where applicable.
  • Versioned release and change log.

Case studies

Anonymized examples of MultiCharts .NET projects we have delivered.

End-of-day portfolio: relative-strength ranking & synchronized pre-close execution

Predictable top-X portfolios with coordinated order submission

Systematic retail / prop trader Development effort ≈90 hours

Problem
The portfolio must hold only the X strongest instruments by a proprietary relative-strength ranking. MultiCharts .NET receives closes asynchronously, and true exchange Market-on-Close is unavailable, so acting in close-arrival order distorts selection and allocations.
Solution
A coordinator that waits for near-EOD prices across the watchlist, buffers final prices, computes the deterministic ranking, and generates target entry/exit orders submitted in a tight, configurable window seconds to minutes before the close. Features: synchronized data collection, ranking presets, submission profiles, priority rules (close weakest first), partial-fill policies, fill monitoring, and a simple UI.
Outcome
Consistent selection and orderly execution near the close, without relying on exchange-level Market-on-Close prices.
Deliverables
Source code, deployment checklist, ranking presets, user guide, validation report.
Interactive Chart Trader with GDI+ drawings

Visual trading mapped to orders

Discretionary trading desk Development effort ≈70 hours

Problem
Traders relied on freehand chart drawings to define trades but lacked a way to convert those marks into consistent orders or to backtest drawing-triggered logic.
Solution
A Chart Trader extension for MultiCharts .NET that captures GDI+ drawings created by mouse clicks (trendlines, rectangles, arrows), recognizes drawing types and parameters (slope, price levels, time anchors), and maps them to configurable trade templates (entry, stop, target, OCO). Includes drawing-validation rules, risk checks, an intuitive draw-to-order workflow, easy undo/delete and on-chart order movement, action logs, and drawing-triggered historical execution using the native backtest engine.
Outcome
Consistent execution of visual setups; fewer manual-entry errors; the ability to test and iterate drawing-based strategies.
Deliverables
Extension source, installation & user guide, sample drawing templates, backtest validation report.

Custom Excel research connector

Bidirectional MultiCharts .NET ↔ Excel

Quant researcher Development effort ≈22 hours

Problem
Idea validation was slow without a two-way link between the platform and spreadsheets.
Solution
Excel integration via .NET interop: scanner outputs stream to Excel while indicators poll Excel to read signals/parameters. Templates and automated sync enable rapid chart-level testing.
Outcome
Faster idea validation and seamless two-way data flow.
Deliverables
Source code, Excel templates, quick-start guide.

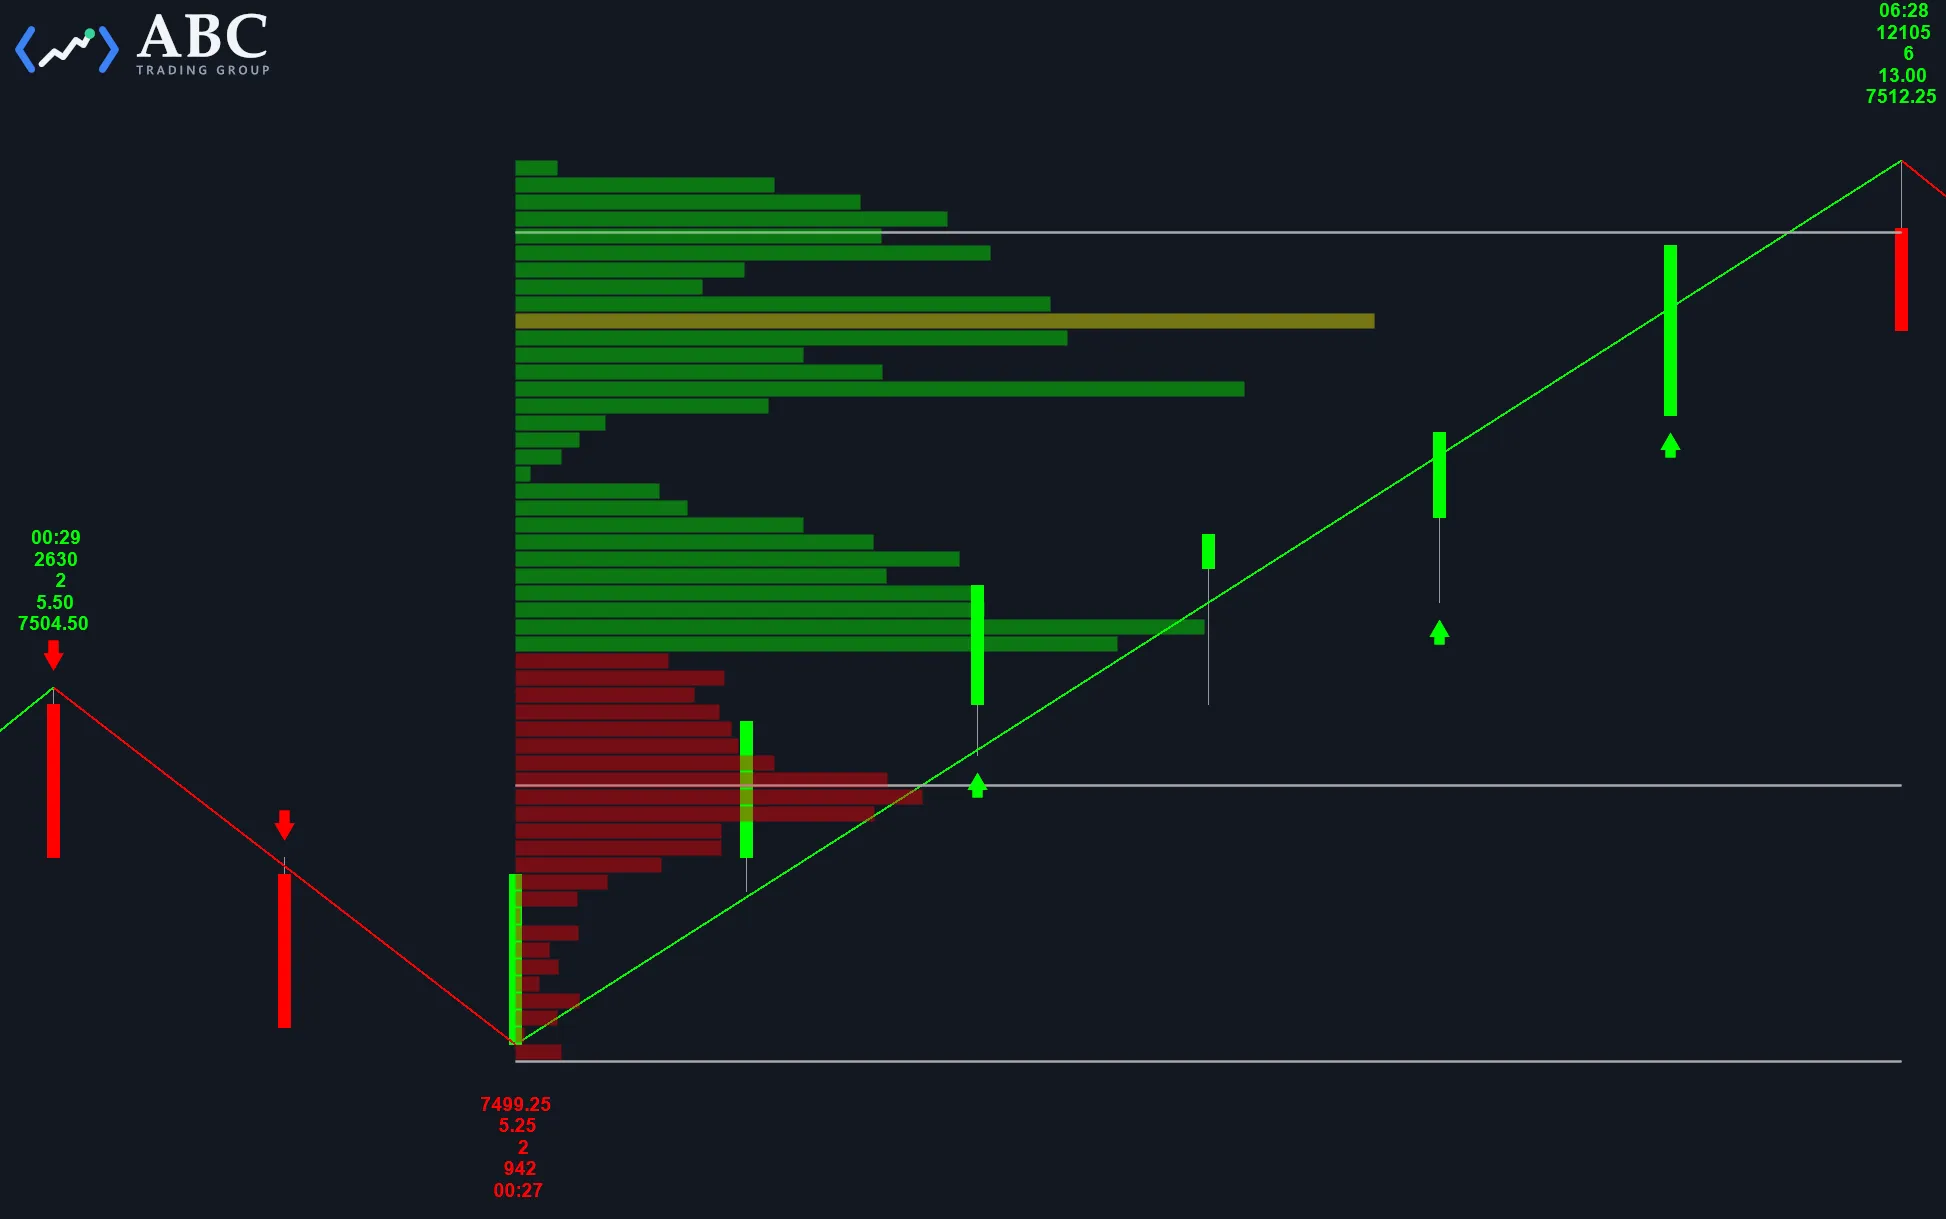
Swing labeler with GDI+

Contextual swing annotation

Price-action trader Development effort ≈30 hours

Problem
Manual swing identification was inconsistent and cluttered the chart.
Solution
An automated swing-labeling indicator that combines algorithmic swing detection with lightweight GDI+ overlays to reduce CPU load and clearly mark swings.
Outcome
Faster discretionary analysis and reproducible labels.
Deliverables
Indicator code, user guide, sample annotated charts.
Dark MultiCharts .NET chart with a green and red zigzag tracing price swings, GDI+ labels listing time, volume and price statistics at each swing extreme, and a green and red volume profile drawn mid-chart.

Virtual advanced bar types

True intrabar backtest fidelity

Short-term systematic strategist Development effort ≈50 hours

Problem
Standard bars limited intrabar execution modeling and produced false positives.
Solution
Virtual bar types that reconstruct intrabar/tick dynamics from available data to support intrabar execution modeling and high-fidelity backtests.
Outcome
More reliable strategy validation with fewer false positives.
Deliverables
Virtual-bar engine, strategy examples, validation report, integration notes.

Volume-profile strategy (optimizer-compatible)

Optimizer-ready volume profile

Futures trader Development effort ≈20 hours

Problem
Volume Profile was unavailable during MultiCharts .NET optimizations.
Solution
A strategy that saves bar-volume bins and reads them during optimizer runs, enabling Volume Profile signals without look-ahead bias.
Outcome
Volume-profile entry/exit parameters became tunable in the optimizer.
Deliverables
Strategy code, user guide.

“I have worked with Chris since 2019 now, and my trading journey on the MultiCharts .NET platform has been so much easier working with him. He has shown professionalism and extensive knowledge in coding, and I can completely rely on his coding service knowing he will fulfill the requirements. In some cases where there is possibly more than one approach to meet the requirements, he would demonstrate the positives and negatives of each, making it easier and clearer for me to choose the best path forward. The agreed turnaround time is always met and in most cases projects are completed ahead of the initially specified time.”

— Mohammad Y., Amman, Jordan

Pricing guide

Indicative ranges. Every project is quoted after scoping.

Indicators / C# studies

$500 – $1,200

Single strategy (spec, backtest, deployment guide)

$1,200 – $4,000

Complex .NET systems / custom Chart Trader / volume-profile tools

$4,000+ (custom quote)

Projects are billed hourly. A final quote follows scoping and review of any existing code. Retainer and ongoing-support options are available and priced in proposals.

Frequently asked questions

What are typical timelines?

Simple indicators — days; strategies — 1–3 weeks; complex systems — 4–10+ weeks.

Can you work with existing code?

Yes. We routinely take over, rescue and improve MultiCharts .NET (C#) projects: diagnose issues, fix bugs, refactor for clarity and speed, extend functionality, and deliver tested, deployable code.

Can you fix code I generated with ChatGPT, Claude or another AI?

Yes — and you’re in good company; it’s one of our most common requests. AI tools are a quick way to prototype an idea, but the generated C# code is often unsafe to trade as-is: typical issues include repainting, look-ahead bias that flatters backtests, fragile order handling and missing risk controls. We review the code against the rules you intended, fix what’s broken, harden it for live conditions and validate the result with proper testing. Send us the code and a short description of what it should do, and we’ll take it from there.

Which MultiCharts .NET versions do you support?

We develop for current desktop releases and note version-specific caveats in deliverables.

Do I receive the source code?

Yes. Every project is delivered as documented, readable source code — not a compiled black box — together with usage instructions.

Do you guarantee profits?

No. You get reproducible testing, documented assumptions and deployment best practices — but no performance guarantees.

Is an NDA available?

Yes — available on request. Independent of any NDA, nothing you share is disclosed to a third party without your prior written consent.

Technical notes & best practices

  • Every delivery includes a PDF manual covering inputs, settings, usage and deployment steps, alongside inline code comments and a change log.
  • Backtests include reproducible scripts and data-range notes for independent verification.
  • Strategy code is written to prevent repainting and look-ahead bias, handle bar replay correctly, and document intrabar execution caveats.
  • C# studies keep calculation threads non-blocking — long-running work is offloaded so charts and autotrading stay responsive.
  • GDI+ resources are cached and disposed correctly to keep custom drawings lightweight during fast markets.
  • Strategies are designed to stay optimizer-compatible — data that is unavailable during optimization runs is precomputed and read back without introducing look-ahead bias.

Ready to turn your idea into working MultiCharts .NET code?

Book a free 15-minute consultation to discuss scope, timeline and pricing. We respond within one business day — often the same day.