
Learn how to create and use functions in MultiCharts and TradeStation
Let’s take a look at what functions are and how they are used. We can use this as the foundation for another lesson, when we look at how to operate the function that comes with our free Value Area Indicator.
In previous lessons we looked at Moving Averages in various forms, and most recently at text and trendlines. The studies we wrote had all their calculations within the main code block. That is fine for demonstrating things, or when you only work with a few lines of code. However, handling ten different moving averages within your code would require you to add the same code ten times. That would make your code much harder to read, and code maintenance would become harder, too.
Think about a logic error you want to fix, or a change to the average formula you want to make. A mistake in the average logic is likely repeated in all ten code blocks. A change to the formula would have to be made in ten separate locations within the code.
What are functions?
Functions can help here. As the developer, you can keep your code in one location: within a function. You can then use this function to provide the results of the computation to any other code.
In the case of a logic error, this is a huge help – the error has to be corrected in one place only. At the same time, that correction affects all other code that calls your function. It doesn’t even have to be as serious as an error: if you simply want to change the logic, you would only have to do that in one place, too.
You also don’t have to add the same code block several times, since you can just call the function instead. This alone helps minimize your work. And by breaking complex logic down into smaller parts, it also improves the readability of your code.
Minimized complexity, improved readability, and less work sounds great – but what exactly are functions?
Simply put, a function is a set of code instructions that return one or more values. Functions have a name, and using that name, an indicator, signal, or other function can call it.
Let’s take a look at how you create functions by turning the moving average logic from lesson 2 into one. This should make things a little clearer.
Create a new function
If the PL Editor is not up and running already, please start it.
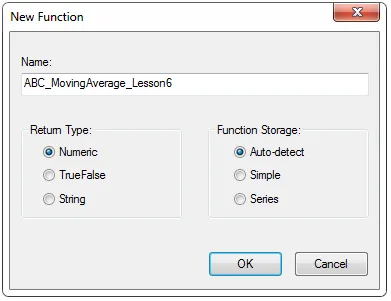
Go to File and click New to create a new function. Set the radio button to “Function” and click “OK”.
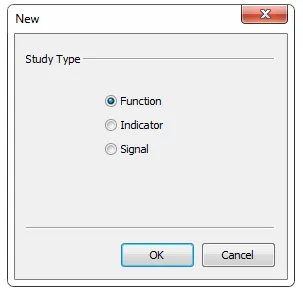
In the next window, we have to give our new function a name. Following the naming from earlier lessons, I will call the function “ABC_MovingAverage_Lesson6”. I am using underscores within the name, as function names may not contain spaces or non-alphanumeric characters. The underscore is the only exception, which is why I use it instead of a space. Please feel free to give your function a different name – just keep in mind that you will have to slightly adjust your code later.
The Return Type specifies the type of result that the function returns to the caller. For the moving average we will return a numeric value, so we set it to “Numeric”. If your function returns a boolean result, the return type should be TrueFalse. Finally, you would use the last option if the function returns a string.
Set the Function Storage to Auto-detect and let the PL Editor take care of the correct storage. In general a function would be “Simple”, unless you reference previous bars’ values in it (using square brackets) – in that case it would become “Series”.
Function Inputs
Our idea is to turn the moving average code from lesson 2 into a function. We also want to be able to easily call it with a different length, or using a different price for the average, later on.
Like the indicator, the function will have two inputs. These let you set the length and the price for the average. We will create similar inputs in the code that calls the function later, so we can alter the results the function returns.
You have to specify a default input value in an indicator. In the function code, on the other hand, you have to specify the type of each input. This makes sure the program knows what input value to expect while the code is running.
Most of the time you will work with three types of function input parameters – Numeric, TrueFalse, or String (text). Each parameter can have one of two main subtypes: series and simple. Although this might sound more complex, it’s very easy when you keep the following in mind:
- If the input parameter is constant, it’s “simple”. A moving average length, for example, would be “NumericSimple”.
- Inputs that refer to values that can change are of the subtype series. That’s why a price series input (like “Close” for the moving average) would be “NumericSeries”.
The rule of thumb is: when the input stays constant bar by bar it’s “Simple”, otherwise it’s “Series”.
//Numeric Input Types

//a constant input value - a length input of "10" for example
ConstantValue          ( NumericSimple ),
//an input that can change its value - like "Close" for example
PriceSeriesValue       ( NumericSeries ),

//TrueFalse Input Types

//a simple true/false switch for example used to enable a certain functionality
CheckCondition         ( TrueFalseSimple ),
//used for a true/false input that can change between true and false from bar to bar
EntryCondition         ( TrueFalseSeries ),

//String Input Types

//a constant string - an email address or symbol name for example
EmailAddress           ( StringSimple ),
//used for text that can change from bar to bar
EmailText              ( StringSeries ),
Function Outputs
You can also use inputs to receive values out of functions. These “outputs” are treated as inputs in the code as well. With these inputs you can reference values back to the caller (indicator, signal, or function). This way you can create a function that returns all the values of many related calculations. The Stochastic function comes to mind as an example here: it doesn’t just return one value, but four (in addition to the normal function return value): Slow %K, Slow %D, Fast %K, and Fast %D.
You declare a reference input similarly to a regular input; the only difference is that you have to add “Ref” to the type. Most built-in functions in MultiCharts and TradeStation that use reference inputs put the letter “o” in front of the input name. This way you can immediately see that an input/output (hence the “o”) is referencing values back to the caller. I would suggest keeping this habit, since it helps make your code clearer and easier to read. The input parameter types are numeric, true/false, and string – which is why the reference inputs are declared as numericref, truefalseref, and stringref.
//outputs a numeric value - for example the result of a moving average computation
oAverageValue          ( NumericRef ),

//outputs a boolean - this could be the true/false result of a conditional check for example
oEntryCheck            ( TrueFalseRef ),

//outputs a string - for example a message that was created within the function
oMessage               ( StringRef ),
Return Value
These output values are in addition to the normal function return value. The latter is of the type specified as the return type when you created the function. The normal return value is assigned to the function name in the code.
All TradeStation functions must have a return value assigned to the function name. MultiCharts, on the other hand, doesn’t require that. You should still make it your habit, as good practice, to always add one (even if it’s just a dummy value like +1). This dummy value can even be used later to check for a successful function call.
You can also pass and reference arrays to and from functions. This is done with NumericArray, NumericArrayRef, TrueFalseArray, TrueFalseArrayRef, StringArray, or StringArrayRef. We will look at this topic in another lesson. For today, just keep in mind that you can pass and reference arrays, too.
What parts do we need?
We want our function to compute a moving average and return the result. This is done by assigning the value to the function name.
Looking at the code we created in lesson 02, we will require two inputs:
- One for the price that should be averaged. From what we learned above, this will be a “NumericSeries” type input.
- One for the length. As this remains constant for the moving average, it will be of type “NumericSimple”.
Let’s use the same names for the inputs as we did in the lesson 02 indicator.
Inputs:
    Price           ( NumericSeries ),
    AverageLength   ( NumericSimple );
Function Code
The main function code will be very similar to the indicator, too. Our function requires a variable used as the counter for the loop, another variable to hold the result of the summation, and finally a variable to hold the result of the division (the actual average result). While it would be possible to use the same variable for the two results, the code becomes more readable when you use two.
Variables:
    Counter         ( 0 ),
    CloseValueSum   ( 0 ), //this variable will store the summation of the close values for the bars
    AverageValue    ( 0 );
We can also reuse most of the main code we wrote for the moving average indicator. It uses the “for loop” to sum the price values over the last X bars (where X is the AverageLength input value). To get the actual average result, we divide the result of the summation by the AverageLength.
//reset the variable storing the summation of close values
CloseValueSum = 0 ;

//sum the close values for the last X bars corresponding
//to our AverageLength input
for Counter = 0 to AverageLength - 1
begin
    CloseValueSum = CloseValueSum + Price[Counter];
end;

//calculate the average; with checking that the AverageLength is not 0 i.e. it's
//smaller and larger than 0 we avoid any issues that an attempt to divide by zero would cause
if AverageLength <> 0 then
    AverageValue = CloseValueSum / AverageLength ;
As you can see, there are only a few differences in the main code block. We can’t use the plot reserved word in a function, and we need to assign the variable AverageValue to the function name instead. This way it can be returned to the code calling the function.
//assing the moving average result to the function name. This way it will be returned to the caller
ABC_MovingAverage_Lesson6 = AverageValue ;
Now click compile in the editor (or press F3) and you have created your first function. Good job.
How do we call a function?
As the next step, we should put our function to use and check that it in fact does what we want. The easiest way to do that is to call the function in an indicator and plot the value it returns. This way we can easily compare it to the indicator code we created in lesson 02.
To make the indicator easy to customize on the chart, we want to be able to set the price used in the moving average and the length via inputs.
As the “heavy lifting” is done within the function code, our indicator just requires one variable that will store the function’s return value.
To receive the result, you simply assign the function name to the variable you want to use. The function name is followed by an opening bracket and the first function input. If the function has more than one input, each input is separated by a comma. After the last input you close the bracket and end the code statement with a semicolon.
MovAvgResult = ABC_MovingAverage_Lesson6( Price, AverageLength ) ;
If you have a function without any inputs, the bracket would remain empty. The full indicator with the function call could look something like this.
Inputs:
    Price           ( Close ),
    AverageLength   ( 10 );

Variables:
    MovAvgResult    ( 0 );

//call the function
MovAvgResult = ABC_MovingAverage_Lesson6( Price, AverageLength ) ;

//plot the result on the chart
Plot1( MovAvgResult, "Average" ) ;
Comparing Results
Let’s compare this study to the one we created in lesson 02 and check whether the results match. Provided we use the same inputs and settings, they should – unless we made a mistake in our coding.
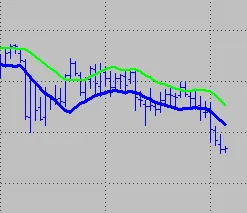
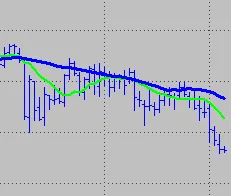
The function-driven indicator is displayed on the chart as the green line. The red line underneath it shows the result of the code we created in lesson two.
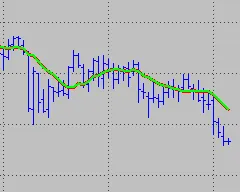
We have an exact match, and now have a function that is able to compute a simple moving average.
I would suggest practicing a little more with how to call and handle functions. You can, for example, expand the indicator that calls our function so it is able to plot two different moving averages. The study should be able to display two averages of the same length but different prices – or, depending on the inputs, the same prices but different lengths.
Conclusion
Today’s lesson may have made it a bit clearer how a function can make your programming life easier. With functions you can write code that is easier to read and easier to maintain. Another benefit is that you don’t necessarily have to know how the code works inside a function in order to use it. All you really need to know is how to call the function and how to handle the value or values it returns.
This concludes the lesson for today. We will come back to functions when we look at how to use the value area function that is part of our free Value Area Study.