

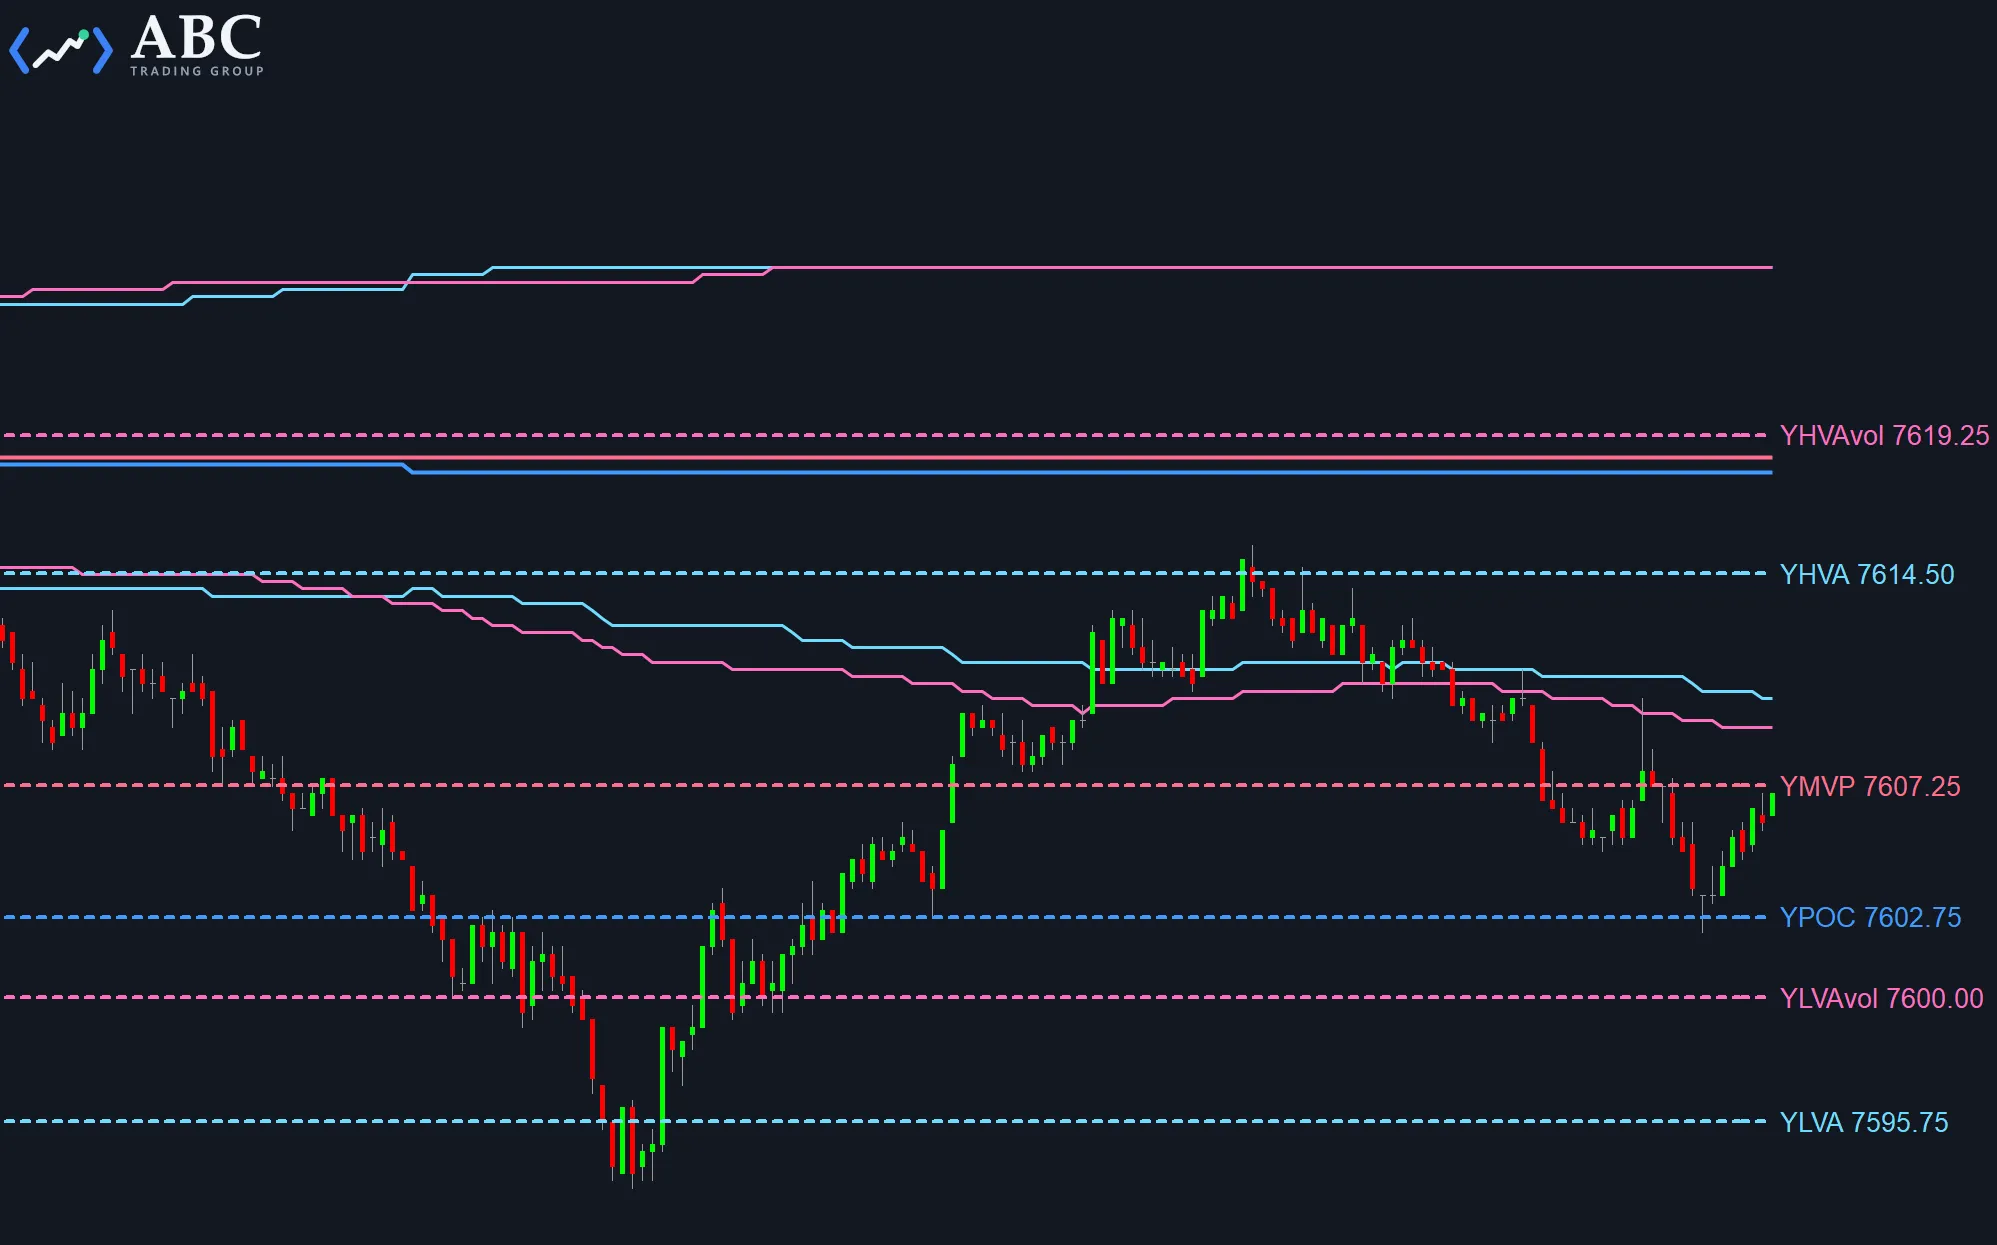
This indicator tracks the volume at each price and the Time Price Opportunity (TPO) count for the chart it is applied to. Based on this tracking, it displays the price where the highest volume was traded and the price with the highest number of TPOs. These two values are called the volume point of control (VPOC) and the point of control (POC).
The study also displays a value area around the VPOC and POC. The value area usually encompasses 70% (roughly one standard deviation) of the daily volume – in the case of the Volume Value Area – or of the total TPO numbers for the day. This concept goes back to J. Peter Steidlmayer, who, as a CBOT trader, developed an intraday charting technique called Market Profile ¹.
Fast Calculation Using Minute Data
MultiCharts comes with the ability to compute and display the value area built in, so why use a separate tool? One difference is that this indicator computes the volume at price derived from the bar interval you apply it to. My suggestion would be to use a 1-minute bar interval for the computations. This allows for a longer history with most data providers compared to tick data, which is what the built-in volume tool uses.
Wouldn’t volume profiles calculated from tick data offer more accurate results? This is correct, but our studies have shown that the difference when using one-minute data is usually negligible. This means the significant values are usually exactly the same, or fall within one tick of each other.
Use the Value Areas in your own indicator or system
One of the most unique features is that the tool comes with a function that allows you to access the realtime and historical values. You can use the values in your own studies, and even use them within systems for automated trading. You will also receive a comprehensive manual that explains the inputs for both the indicator and the function, in case you want to customize the studies to your needs.
As a bonus, a demo indicator is included that shows you exactly how to call the function, so you can easily use it in your own code. This way you can create your own signals and indicators that use the support and resistance values computed by the value area tool. If you’d like to see how the function is called, take a look at the Value Areas from a function tutorial.
- Market Profile® is a CME Group owned market data product. If you want to learn more about it, I would suggest buying a copy of the great book Mind Over Markets by James F. Dalton, Eric T. Jones, and Robert B. Dalton.