

Creating the first real indicator and expanding the basics
After you familiarized yourself with the PowerLanguage Editor in the previous PowerLanguage tutorial – lesson 01, we will now build on that foundation. If you haven’t read the last lesson, I would suggest doing that first, as it can help you understand this lesson, too. Let’s start with today’s lesson now.
Open the PowerLanguage Editor and create a new Indicator study. I will name mine “ABC_PowerLanguage Lesson 02 – Moving Average”, so I can find it easily within my editor later. The name is totally up to you, of course, and you could even change it later. As the last part of the indicator name suggests, we will create and plot a moving average today.
You have probably seen a moving average on a chart before, or remember the term average from math. The main use for averages is as a filter to smooth the data you input.
Smoothness versus lag
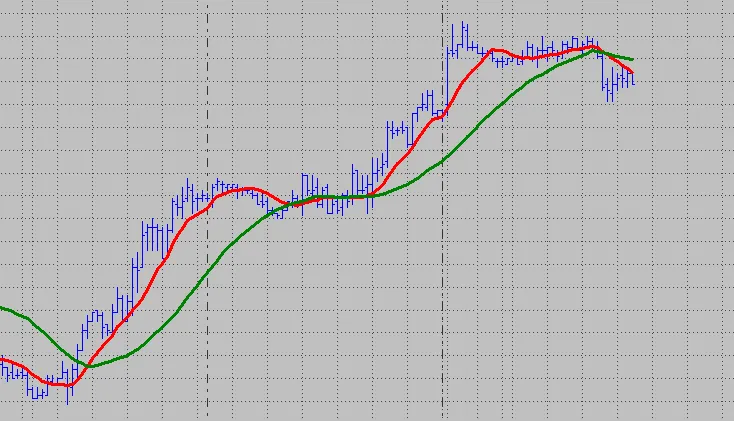
The image above displays a 200-period simple moving average that gives a very smooth outcome. The downside to this smoothness is that you introduce more lag. This means the average becomes less responsive to changes in price. If you take a look at the next image, you will see how different the behavior of a 200-period simple moving average is when you compare it to the green 10-period average. The latter is much quicker in responding to price changes, but in turn there is a lot more “noise” in the average.
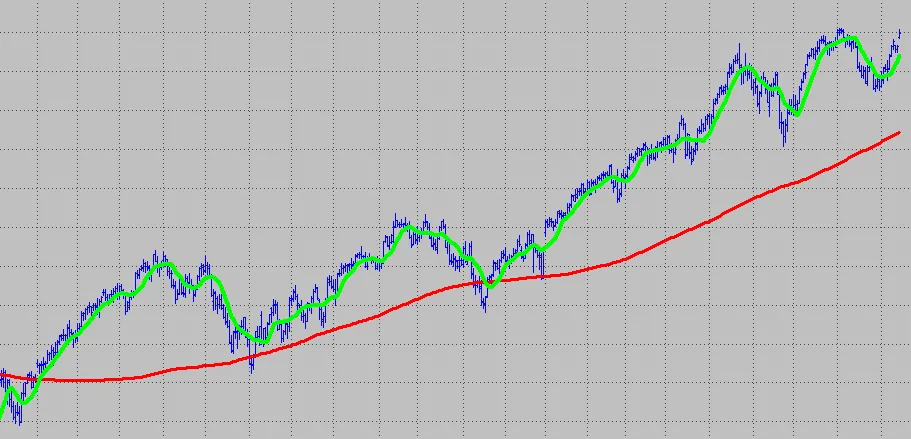
There are many different types of averages, which mainly vary in the impact each data point has on the outcome. A 200-period simple moving average simply computes a summation of the last 200 data points and divides it by 200. The result is an average that gives each data point the same influence (the same weight) on the outcome. The first bar and the last bar that are part of the average are both weighted the same.
Two other prominent and commonly used averages are the Exponential Moving Average and the Weighted Moving Average. Both give higher weighting factors to the more recent data points. In a weighted moving average the weighting decreases in arithmetical progression. For the exponential average it decreases exponentially, hence the name. This is as theoretical as it will get for today. If you want to read some more details about averages, you can start with this Wikipedia article – though you won’t need that additional information to follow this lesson.
Planning the code
Let’s start coding our average. Our indicator should not only calculate an average, but also output the result to a chart. EasyLanguage has the “Plot” reserved word for that, and we will use it to do so.
Before you start programming something, it’s always a good idea to take a step back and think about what you are trying to accomplish and how you are going to do it. As this study is not very complex, there are only a few things to think through. When studies get more complex, you can save a lot of time with good planning upfront.
The goal is a study that calculates and plots a simple moving average.
We want to be able to change the length for the average with an input, so it’s easy to customize.
For the average, we need to sum the amount of values correlating to the length input. We don’t want to write code for every possible length input for the summation. This means the code needs to be able to calculate all possible length inputs on its own. Do you already have an idea how we could accomplish this?
The answer is that we need an iteration statement that can be executed repeatedly each bar for a specific number of times (our length input). I know this sounds complicated, but it will be quite simple. We will use the “for loop” for this task. This loop repeats one or more statements for a user-defined, specific number of iterations.
How a for loop works
EasyLanguage code is executed from top to bottom, and usually from left to right. Once one code line is executed, the next line is executed, and so on. When the code line is the beginning of a loop, the code lines within the loop are executed for the specified amount. Only when the loop is finished is the next code line after the loop executed.
A for loop looks and works the following way: a numerical variable is incremented (or decremented) with every cycle through the loop, from its start value to its end value. The code below displays a basic for loop with a numeric counter variable (“ii” in this case) and an initial value of 0. The iterations are done ten times, until the counter has reached the value of 9. Then the loop block is executed the last time and exited. You don’t have to increment the counter value yourself – the loop code takes care of that. The current counter value is stored in the counter variable, so you can access it for every loop cycle and use it in your calculations. This will come in handy for calculating our average.
for ii = 0 to 9
begin
//do something ten times in here and move to the
//next code line after the "end;" when done
end;
The for loop can also decrement the counter with every iteration. The initial value in this example is 9, but the loop is executed ten times until it is exited, too. The counter simply decreases with every iteration by one until it reaches 0.
for ii = 9 downto 0
begin
//do something ten times in here and move to the
//next code line after the "end;" when done
end;
Referencing previous bars
In EasyLanguage you can reference data-related reserved words, variables, and functions from a previous bar very easily. Using a number within square brackets following the reserved word, calculation, or variable will return the value for that particular bar. The number grows from the current bar (which you reference with [0]) in increments of one. When you want to store the value of the previous bar’s close within a variable called PrevCloseValue, you can do it like this:
PrevCloseValue = Close[1];

//this line will return the same value as the above one, too
PrevCloseValue = Close of 1 Bar Ago;
We want to build our average using the Close for the last X bars, where X is an input to allow for more flexibility. You already know that we want to use a loop for that, and we just found out how we can reference Close values for previous bars. This should be enough to write the code for the main part of our indicator.
Creating the inputs and variables
Let’s continue by creating the input and variable sections. You might recall from the last lesson that using meaningful variable names is good coding practice and can save you a lot of trouble later.
We need to declare one input so we can change the length of our average on the chart. Besides that, we want one variable to hold the summation, one to hold the counter value, and a last one to store the average value.
For outputting the value on the chart we use the reserved word Plot. This is followed by a number, so you can distinguish between different plots – which is needed, as you can use up to 999 plots in MultiCharts. The plot reserved word can take several parameters, such as color, plot size, and more. We will keep it simple here and use Plot1 with just two parameters: the first for the numerical expression to be plotted, and the second for the name we want to assign to the plot. The final code will look something like this:
Inputs:
    Price           (Close),
    AverageLength   (10);

Variables:
    Counter         (0),
    CloseValueSum   (0), //this variable will store the summation of the close values for the bars
    AverageValue    (0);

//sum the close values for the last X bars corresponding
//to our AverageLength input
for Counter = 0 to AverageLength - 1
begin
    CloseValueSum = CloseValueSum + Price[Counter];
end;

//calculate the average; with checking that the AverageLength is not 0 i.e. it's
//smaller and larger than 0 we avoid any issues that an attempt to divide by zero would cause
if AverageLength <> 0 then
    AverageValue = CloseValueSum / AverageLength;

//plot the result to the chart
Plot1(AverageValue, "Average");
Checking the indicator properties
After compiling this code, we are almost ready to load our indicator onto a chart in MultiCharts. Let’s just take a look at the properties of the indicator first. You can find them under File → Properties, or by clicking the Properties symbol in the menu (it should be the one to the left of Compile).
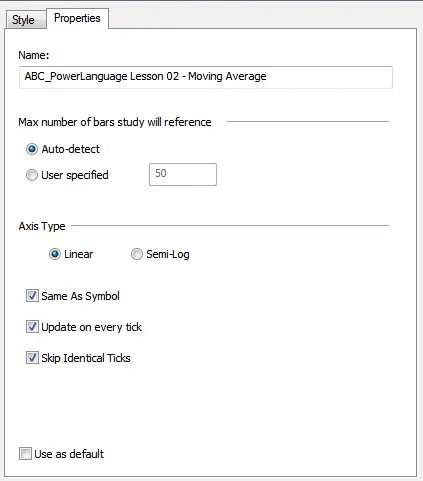
Under the Style tab you can change the color, line style, and thickness for the plot you created. On the properties tab there are several options to set or check, but for now you might only want to make sure the option “Same As Symbol” is checked. This makes sure the indicator is applied directly on your chart rather than in a subchart.
Now you are ready to apply the indicator to a chart of your choice. When you have a chart open in the MultiCharts main window, you can simply insert the indicator onto this chart.
The bug: a missing reset
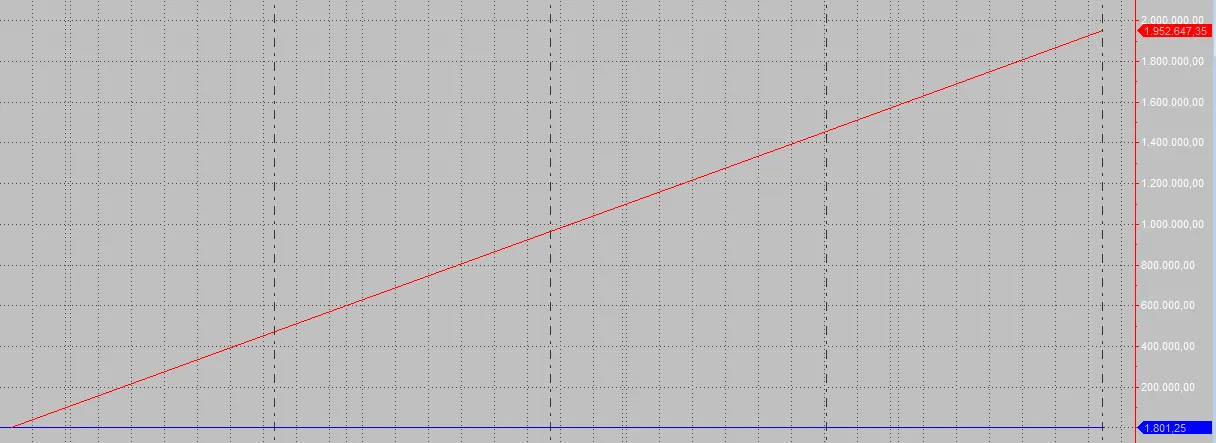
When the indicator is applied, the outcome should be similar to the above screenshot. However, this doesn’t seem right – it doesn’t look like a moving average at all. The price series is almost a flat line, and the plot coming from our indicator is only rising. With the E-Mini S&P 500 being in the area of 1,800, a 10-bar moving average value for this market of 1,952,647 is obviously not correct. This points towards a problem in our calculations. Note that the code compiled without a single error – the compiler has no way of knowing what a moving average is supposed to look like. That gap between compiling and working is worth a closer look on its own.
Do you have an idea what the code is missing? It’s actually just a small, but very important, detail we forgot to add. We need to add something in front of the for loop. The loop simply keeps adding the values for the previous ten bars with every new bar. That’s fine – we want it to do exactly this – but we don’t want it to add the new values to the old values. In other words, you need to make sure CloseValueSum doesn’t still hold the old values when the for loop starts. By adding one line to the code, the outcome is exactly what we wanted to achieve.
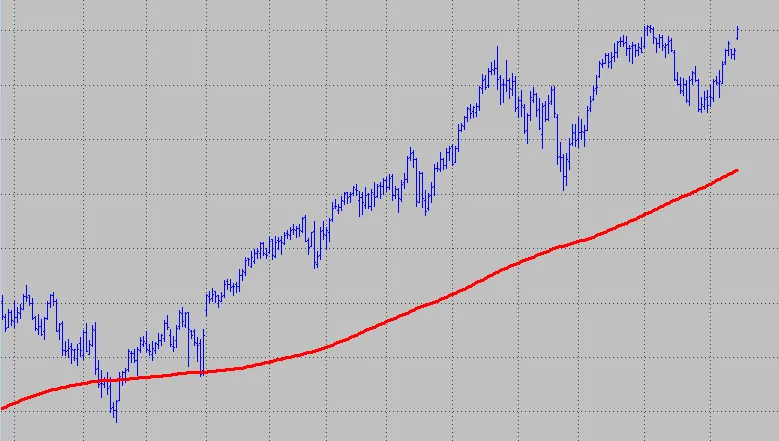
We can also change the indicator’s appearance on the chart. Using the style tab under “Format Study”, we can alter the visual outcome, such as line style, color, and thickness. Under the “Inputs” tab you will find the input you created and the default setting for the length. By loading a second instance of the study and using a different color and length, you can confirm that the study gives a different outcome with a different length input.
If you are having trouble finding the correct fix, feel free to contact us with your solution and we will try to help you in a timely manner. I’m afraid just asking for the solution won’t work, though – you need to at least be able to show that you put some effort into finding it. As a last hint, you can take a look at other average indicators or functions and find some inspiration for the missing link there. I hope you enjoyed this PowerLanguage tutorial lesson, and I am looking forward to working with you in the next one, where we take a look at the while loop.