Free Indicator Download
Free, production-tested MultiCharts studies — documented and ready to import. The collection grows over time, and your comments and ideas for new tools are always welcome.
Subscribe on any tool below to receive its download link by email, plus free updates and new tools as they are released — so it is worth checking back.
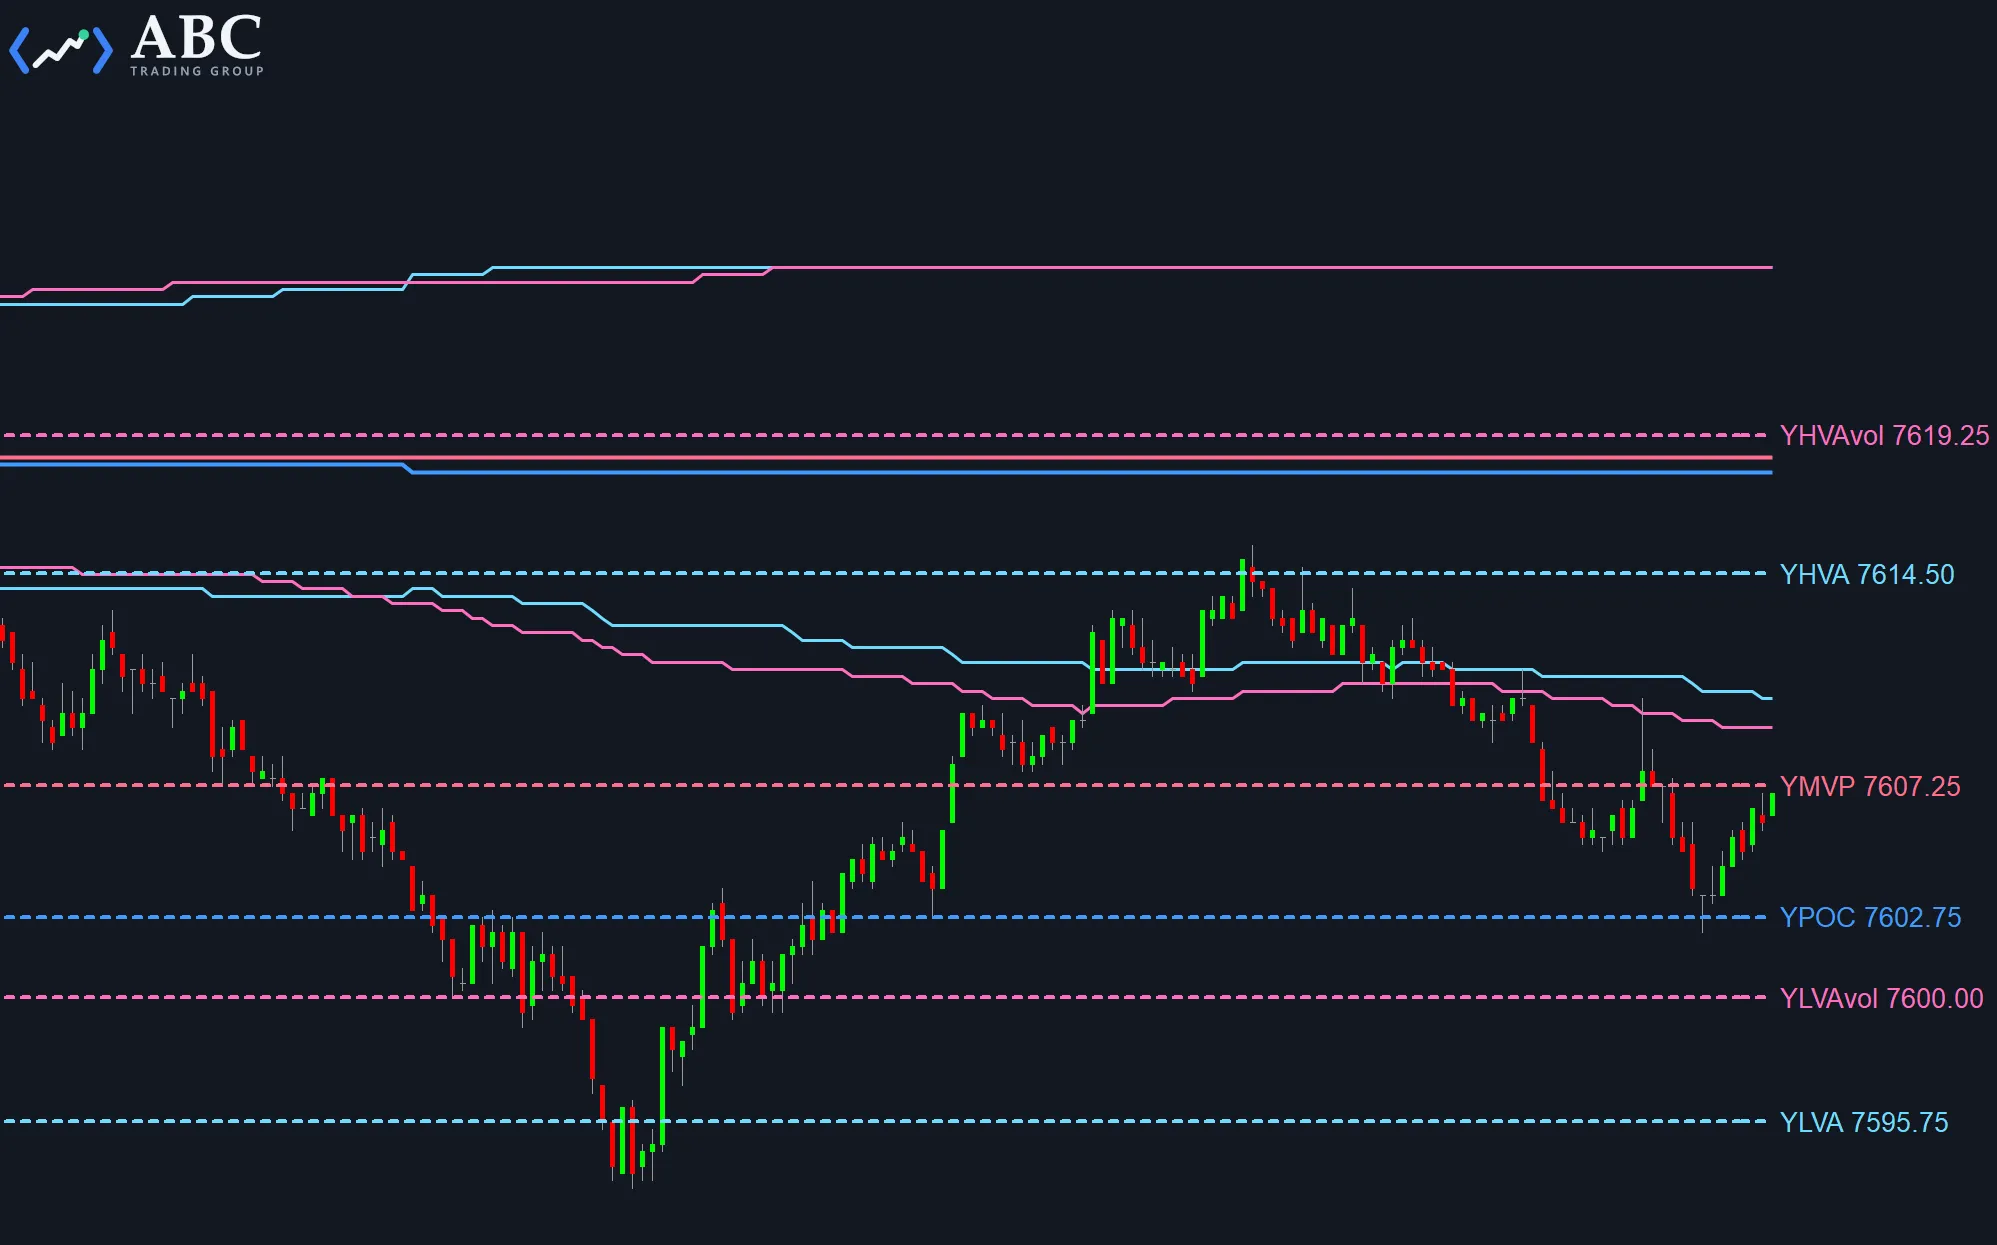 MultiCharts Volume and TPO Value Area Indicator and Function Get your free Value Area indicator for charting. Build your own trading system or indicator with the included Value Area function.
Get this tool
MultiCharts Volume and TPO Value Area Indicator and Function Get your free Value Area indicator for charting. Build your own trading system or indicator with the included Value Area function.
Get this tool 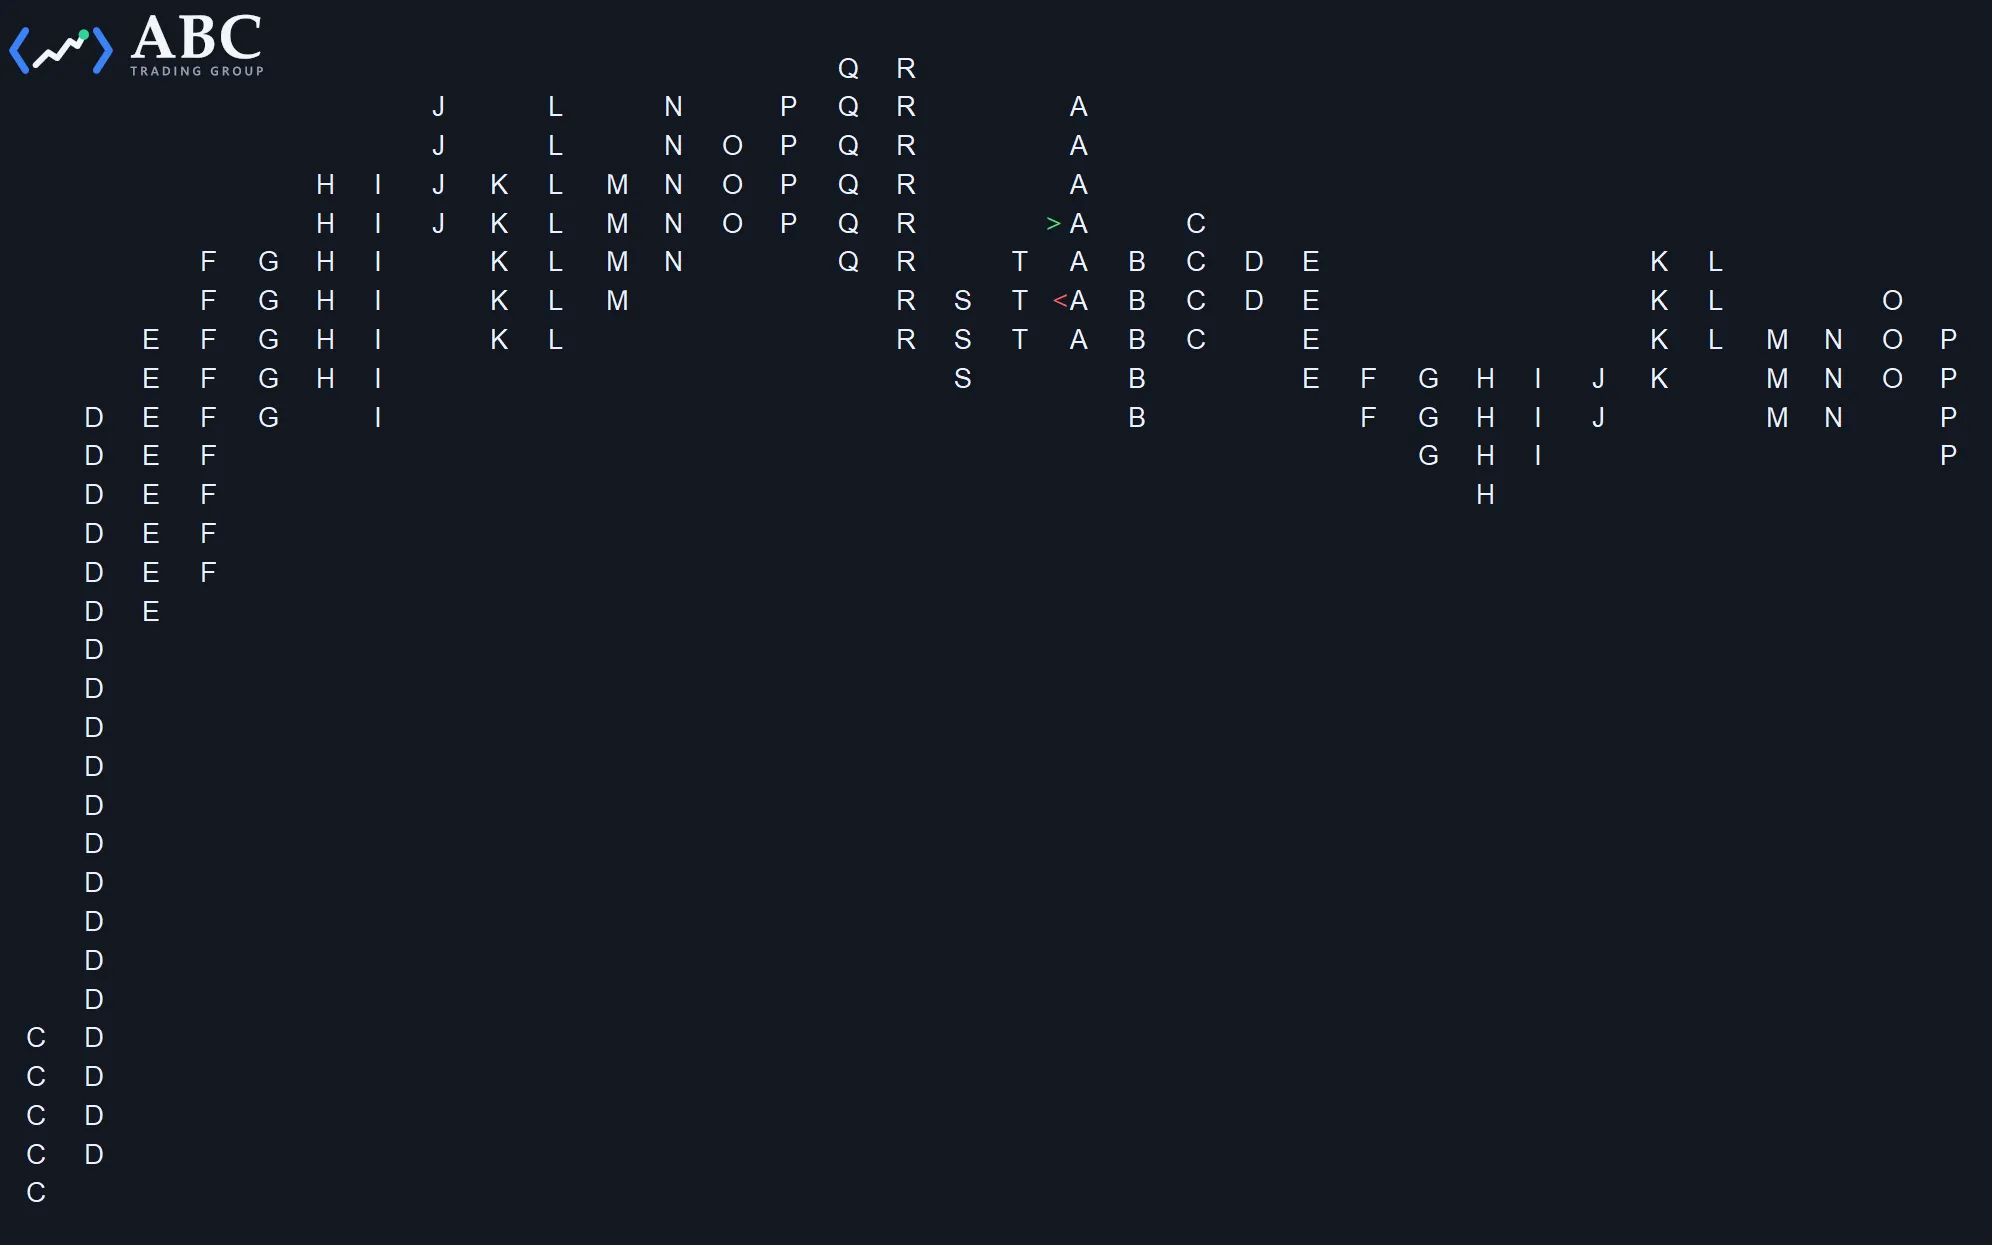 MultiCharts Unstacked TPO Chart Indicator A TPO Chart offers a powerful way for performing market analysis. Download your free copy of our unstacked TPO Chart indicator.
Get this tool
MultiCharts Unstacked TPO Chart Indicator A TPO Chart offers a powerful way for performing market analysis. Download your free copy of our unstacked TPO Chart indicator.
Get this tool 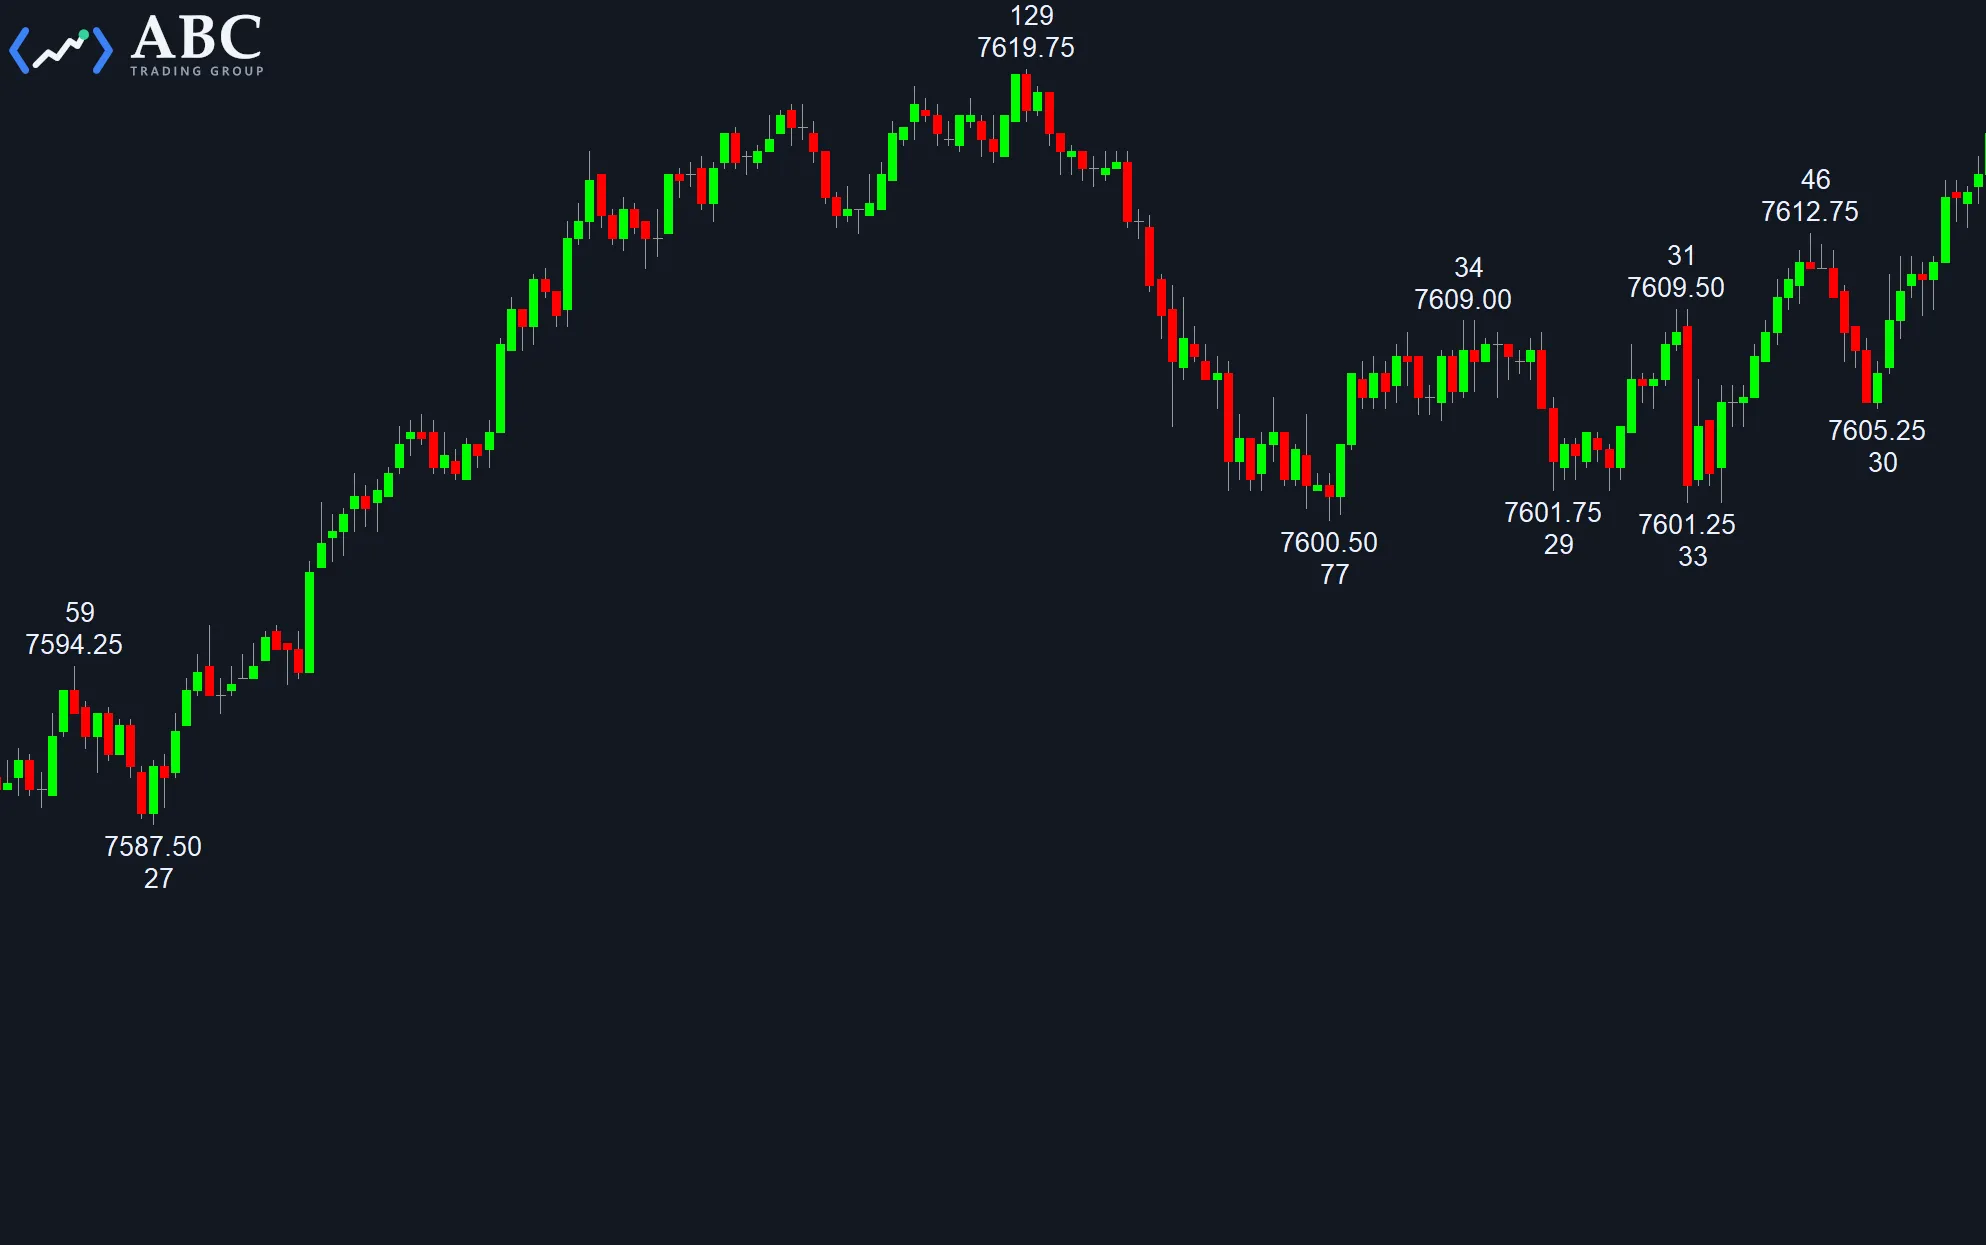 MultiCharts Swing High Swing Low Text The Swing High Swing Low indicator displays swing points based on retracement values. Download it free and adjust the settings to your market.
Get this tool
MultiCharts Swing High Swing Low Text The Swing High Swing Low indicator displays swing points based on retracement values. Download it free and adjust the settings to your market.
Get this tool 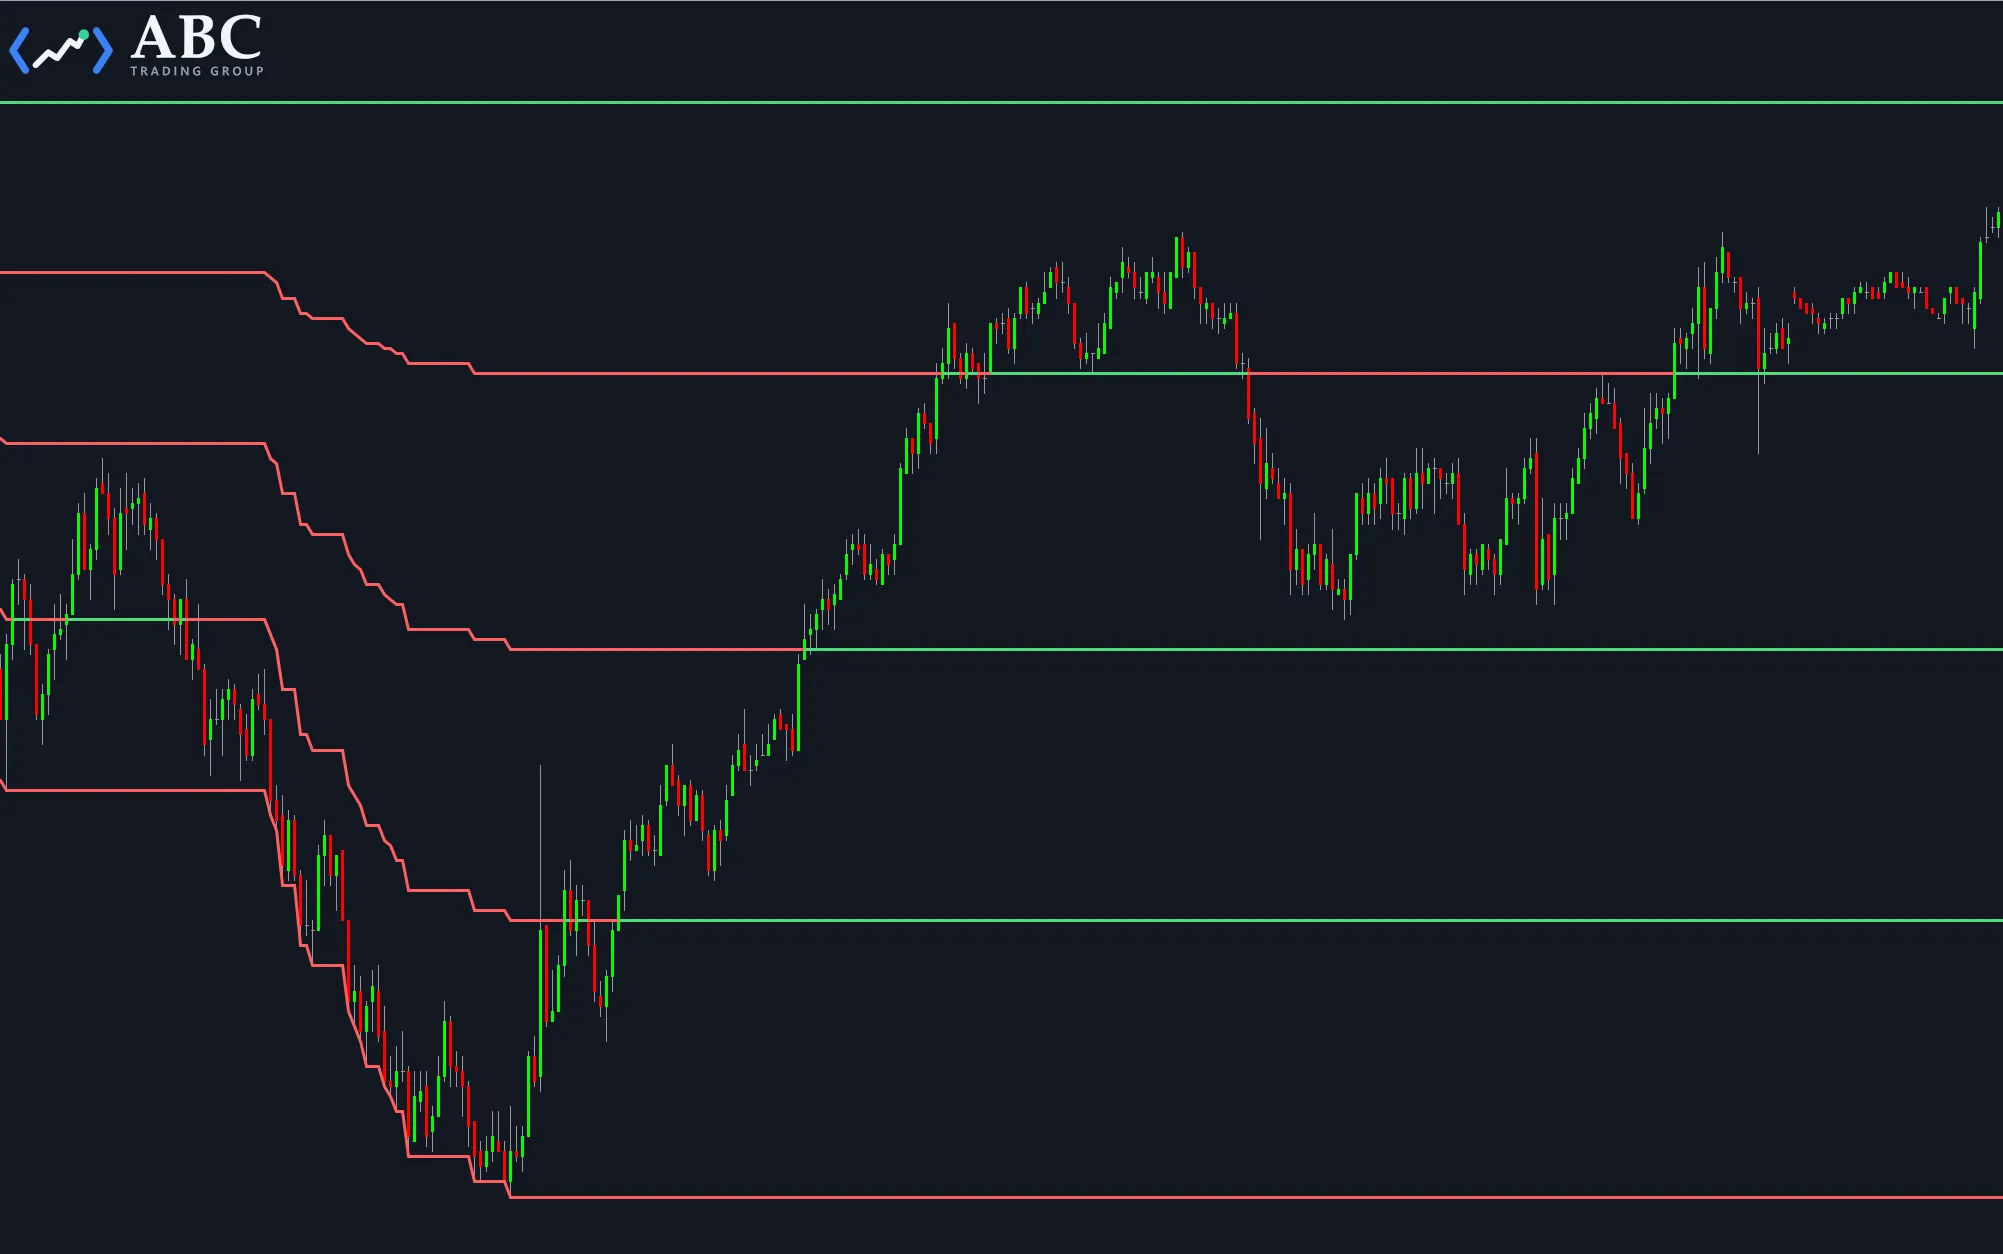 MultiCharts Midpoints Study The free Midpoints study can be used to display support and resistance. Download your copy of the free, open code Midpoints study for MultiCharts.
Get this tool
MultiCharts Midpoints Study The free Midpoints study can be used to display support and resistance. Download your copy of the free, open code Midpoints study for MultiCharts.
Get this tool 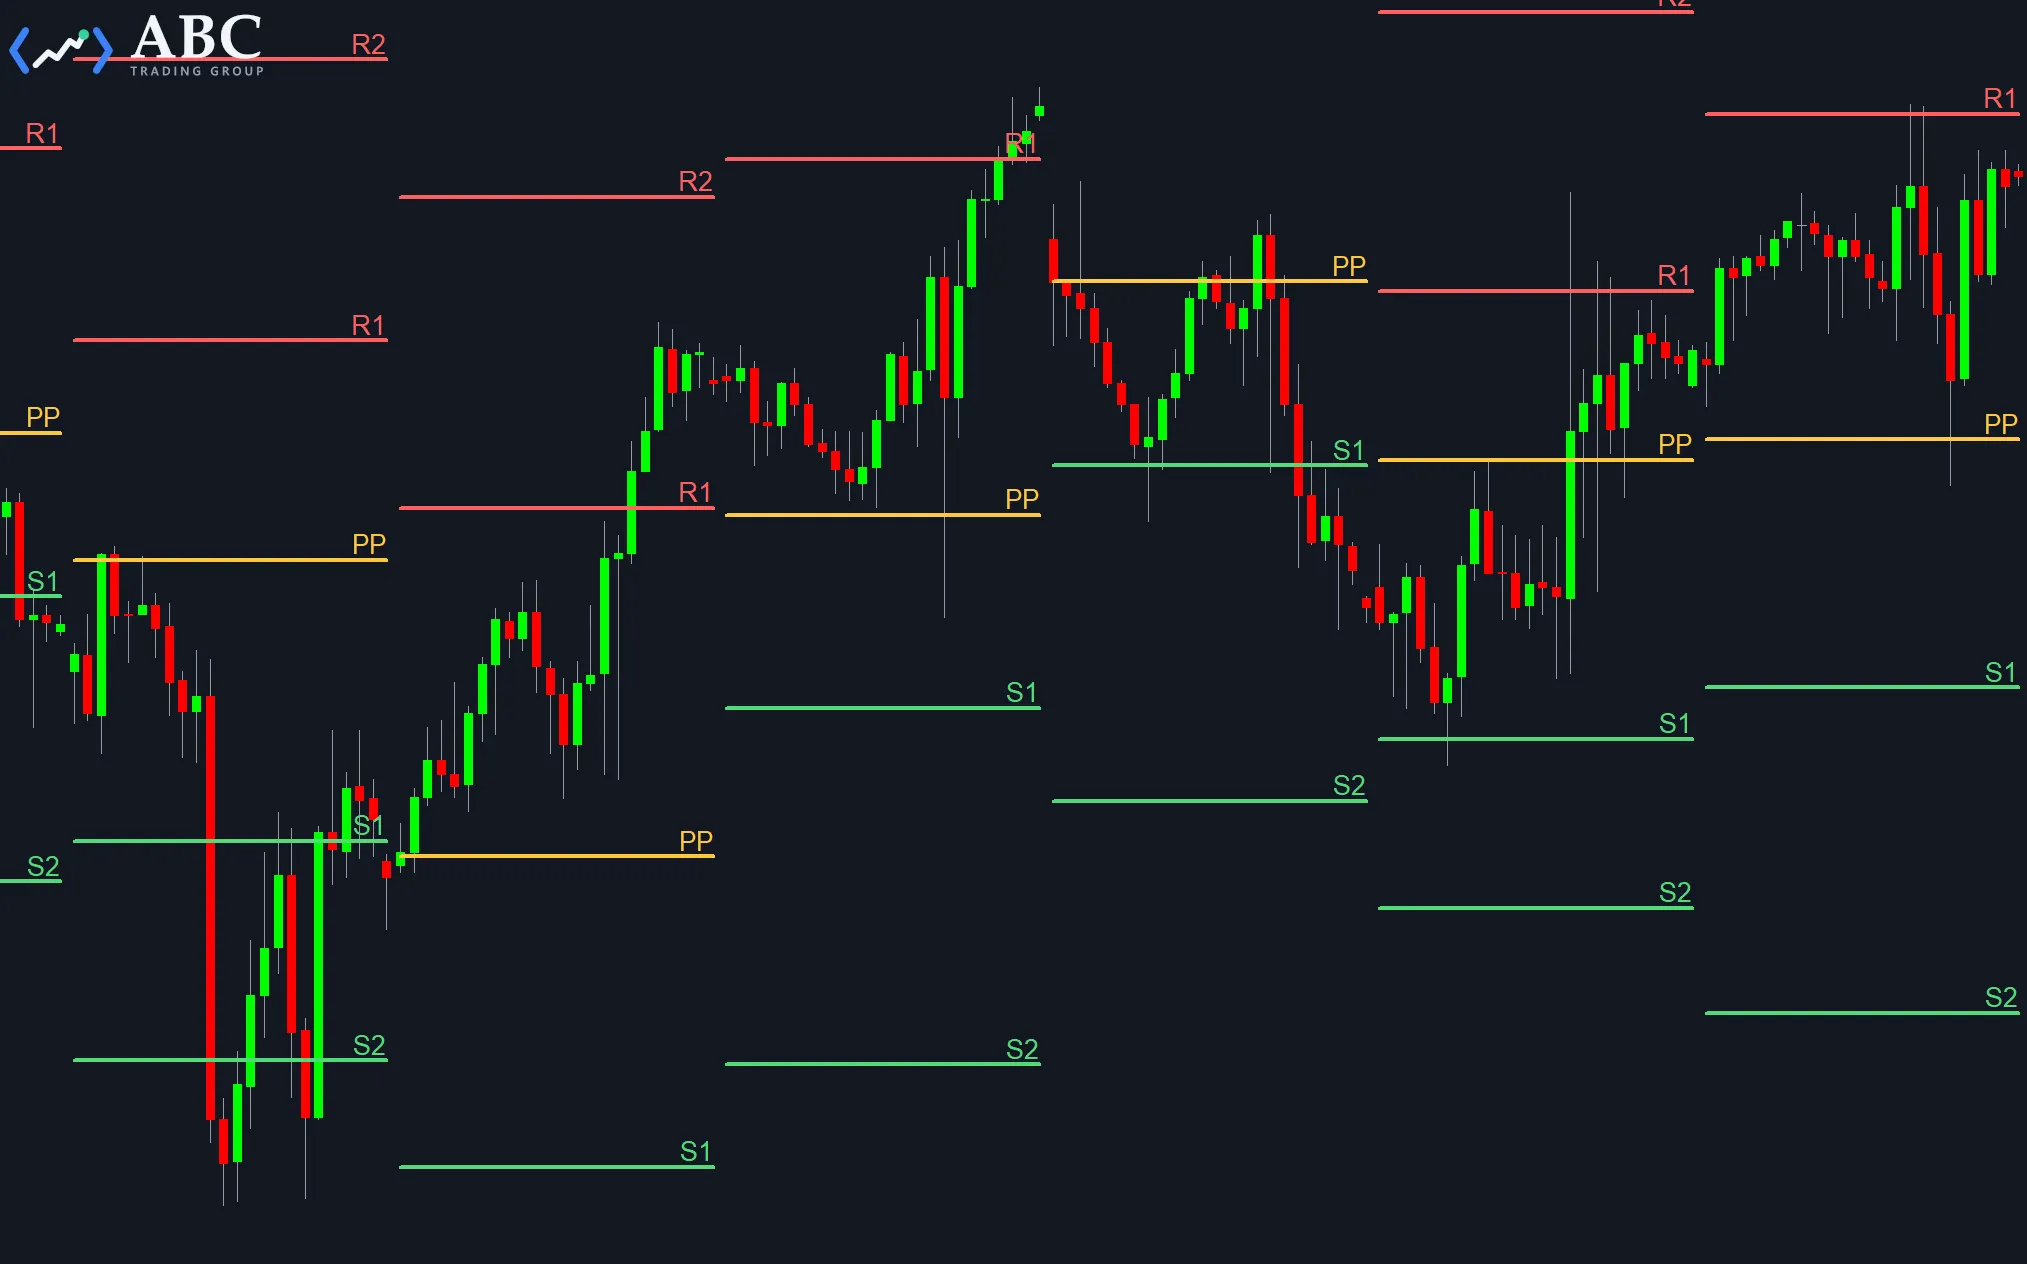 MultiCharts Floor Trader Pivots Floor Trader Pivots are horizontal lines for support and resistance. Download your free copy of our Floor Trader Pivots study.
Get this tool
MultiCharts Floor Trader Pivots Floor Trader Pivots are horizontal lines for support and resistance. Download your free copy of our Floor Trader Pivots study.
Get this tool 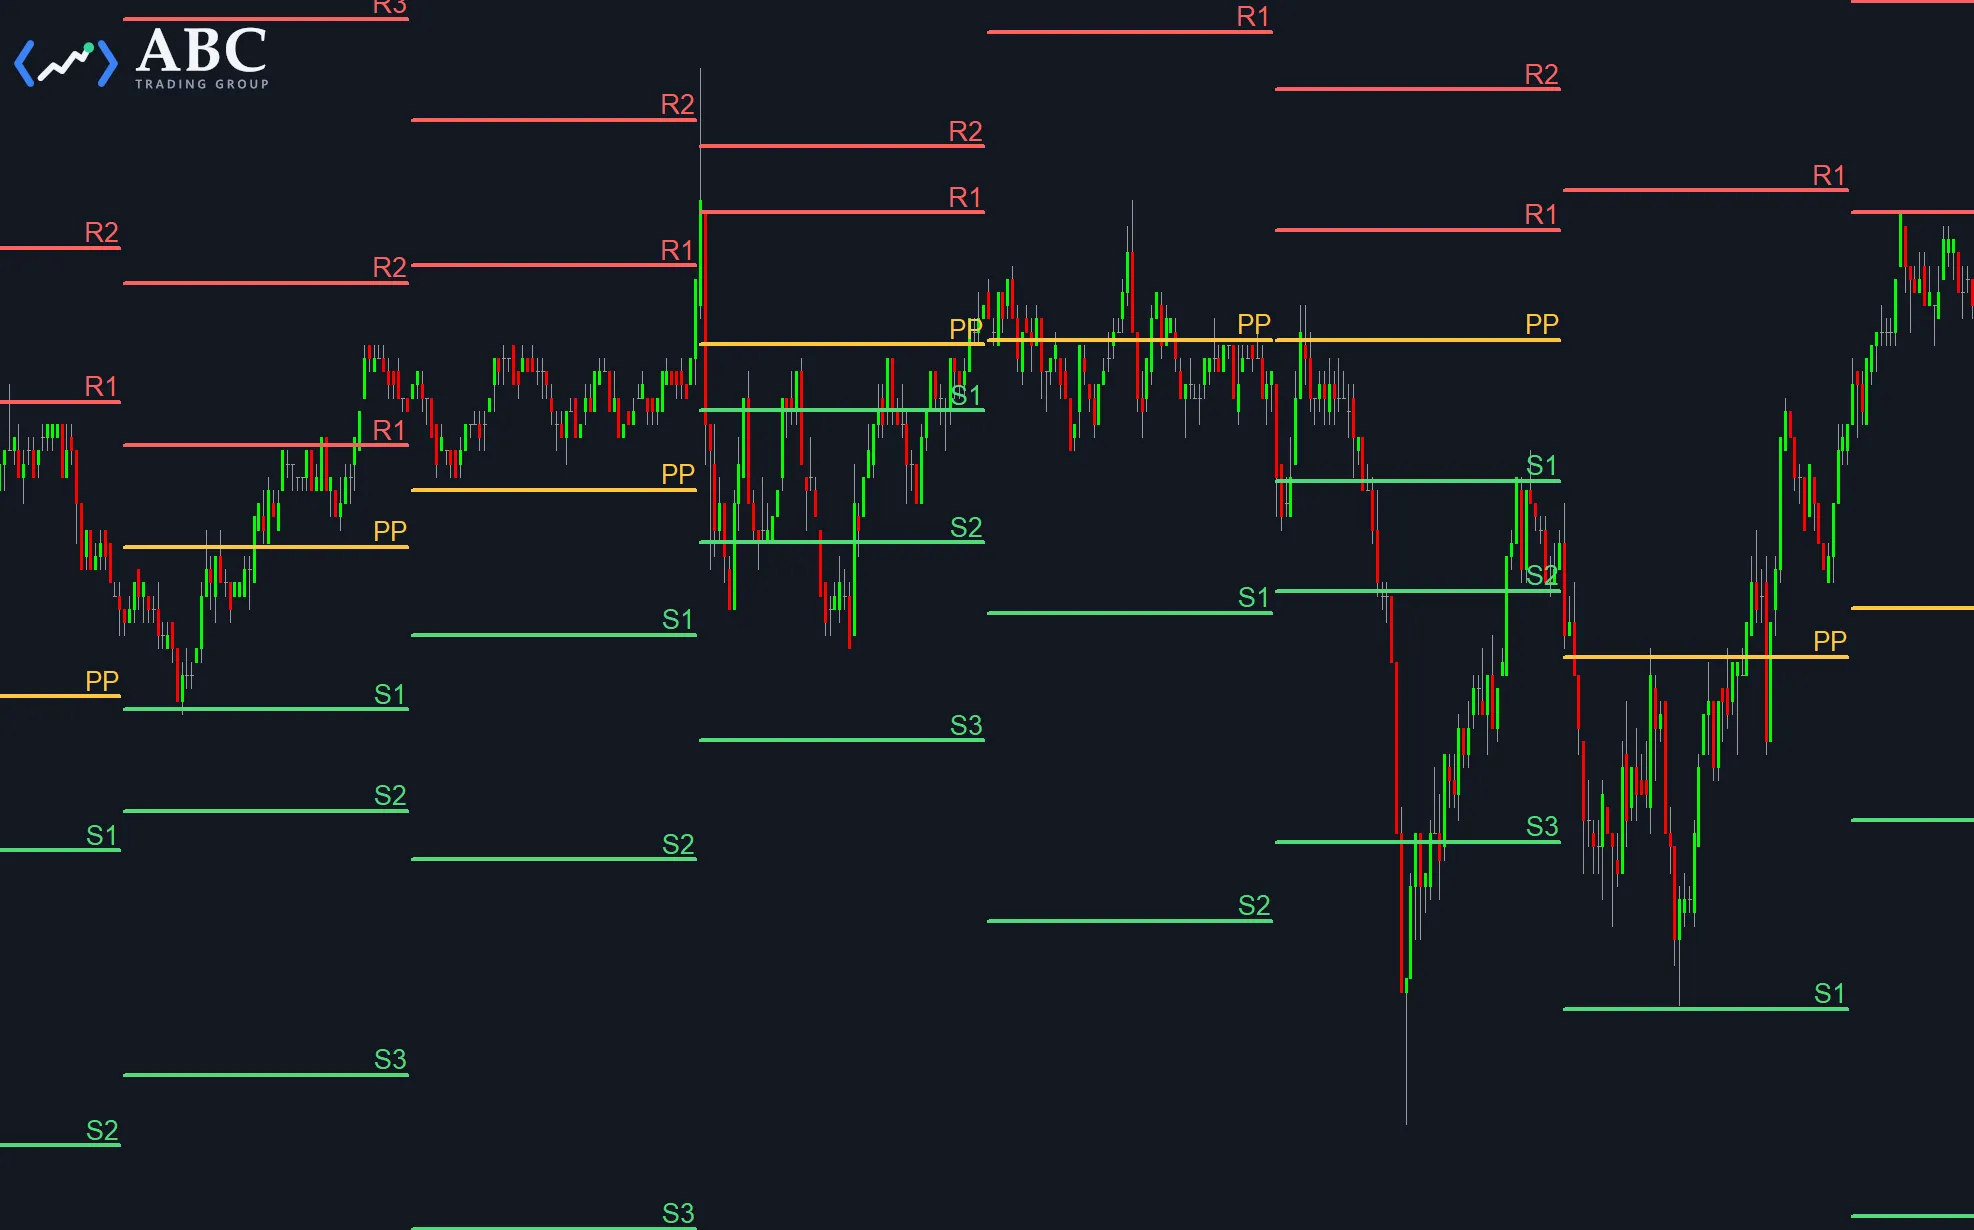 MultiCharts Hourly Floor Trader Pivots A variation of our free Floor Trader Pivots study that starts a new set of pivot levels every hour. Download your free copy for MultiCharts.
Get this tool
MultiCharts Hourly Floor Trader Pivots A variation of our free Floor Trader Pivots study that starts a new set of pivot levels every hour. Download your free copy for MultiCharts.
Get this tool Good to know
How you receive and install the studies
Delivery is by double opt-in: after you subscribe you will receive a confirmation email, and once you click the link in it your download is ready within seconds. We never sell or share your details — see the Privacy & GDPR notice.
Some studies arrive as a ZIP archive that needs unpacking before you can import the study into MultiCharts. Any archive tool works; if you don't have one, we recommend the free open-source 7-Zip.
Sharing & licensing
You may share all studies freely, as long as the copyright notice is included. If you post them anywhere, please link back to this page so other users can always find the latest revision.
Disclaimer
All studies are distributed in the hope that they will be useful, but WITHOUT ANY WARRANTY; without even the implied warranty of MERCHANTABILITY or FITNESS FOR A PARTICULAR PURPOSE. The studies provided by ABC Trading Group are for demonstration purposes only. Using any study in any other manner is at your own risk.
This free indicator download section should also give you an idea of our EasyLanguage and PowerLanguage coding abilities. If you have questions or a project idea, don't hesitate to contact us.