
Custom Sentiment Index
Often times a project requires a study to be able to access data or values from other charts or sources like text files for examples. At the same time it’s crucial to accomplish this in a user friendly and easily customizable way. While it is possible to have several data sources within one chart, it can become hard to handle quickly. More data streams diminish the visibility of each individual data stream. Referencing each data stream in the code can make your code less flexible.
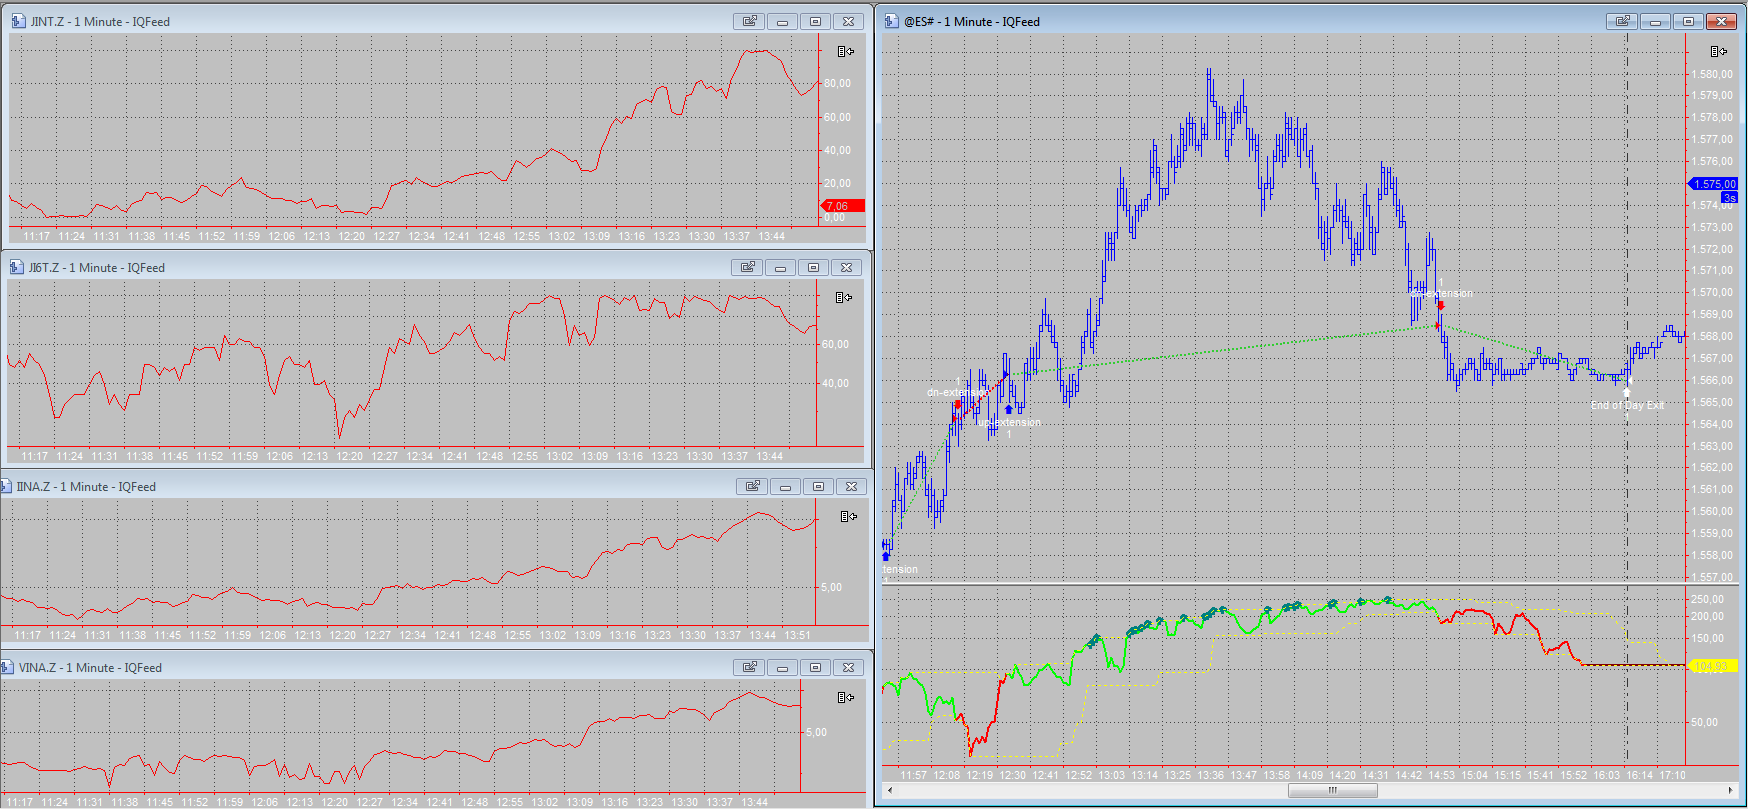
The goal for this project was to build a custom sentiment index. It was constructed out of several individual streams of data. None on the data streams was coming from traditional indicators. This means indicators, which display information by a derivation of price data. The sentiment index had to be constructed from several market internals, order book information and proprietary implied volatility calculations.
A moving average for example would be derived from price directly. It only gives you a delayed image of the situation you can see within the price data directly. The average will be smoother than the raw price data, but introduces a certain amount of lag.
When building an index each index component usually has a different price value. Therefore it is crucial to normalize the inputs. It is also possible to weight each component differently. After the normalization you can calculate a meaningful sentiment index.
The final custom sentiment index was displayed with an indicator, so it could be used for manual trading. This indicator can automatically track the extremes and draw trendlines based on user conditions. Once set up, the indicator was able to perform the tasks the trader had to do manually before.
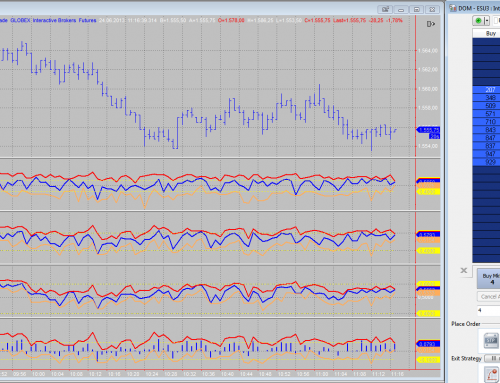
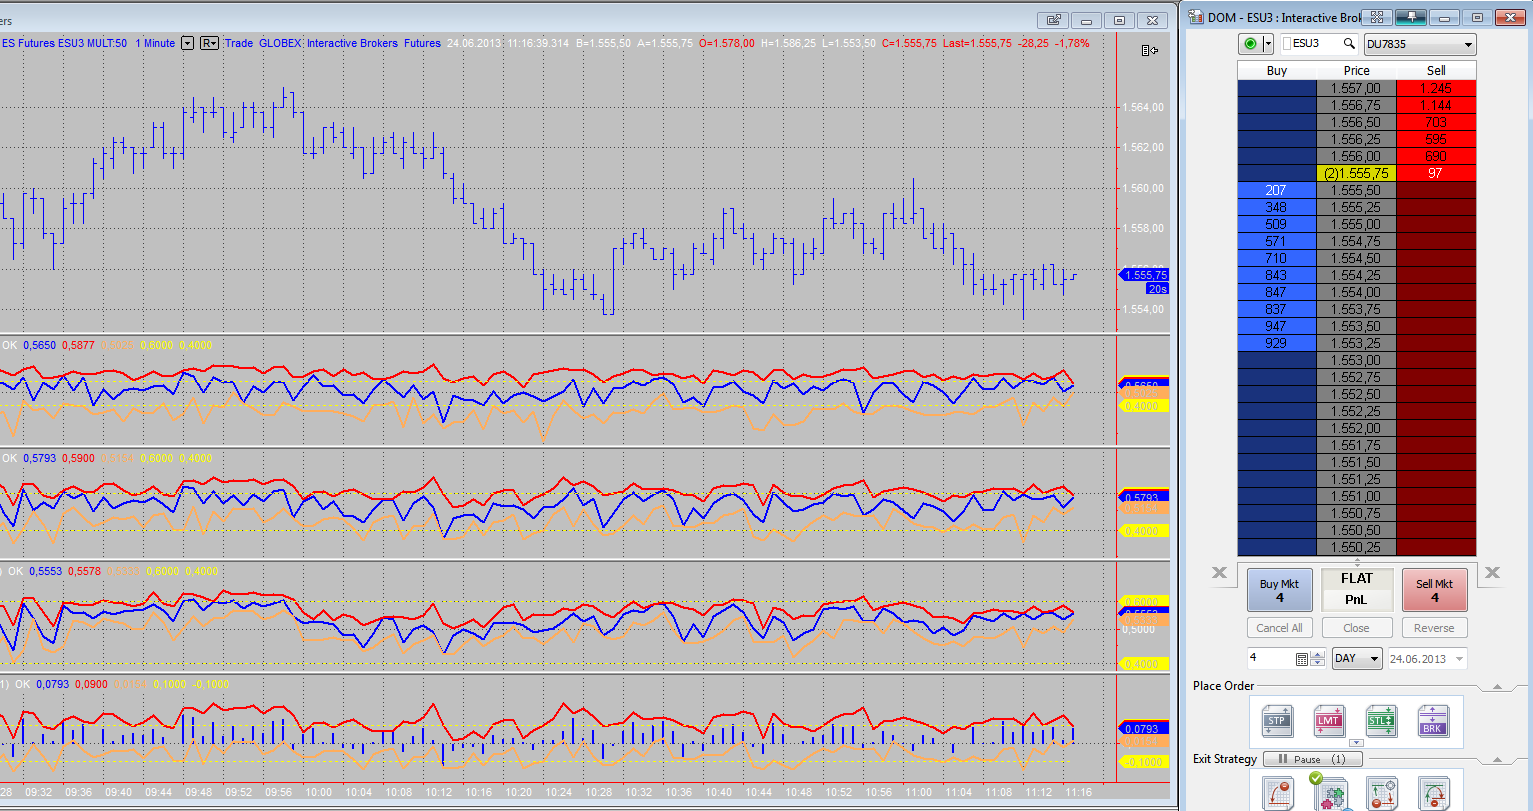
Besides displaying the sentiment index for manual trading, we also built an automated trading system that is generating signals based on the sentiment index.