

Tick-Data Volume Profiles with Automated Node Detection
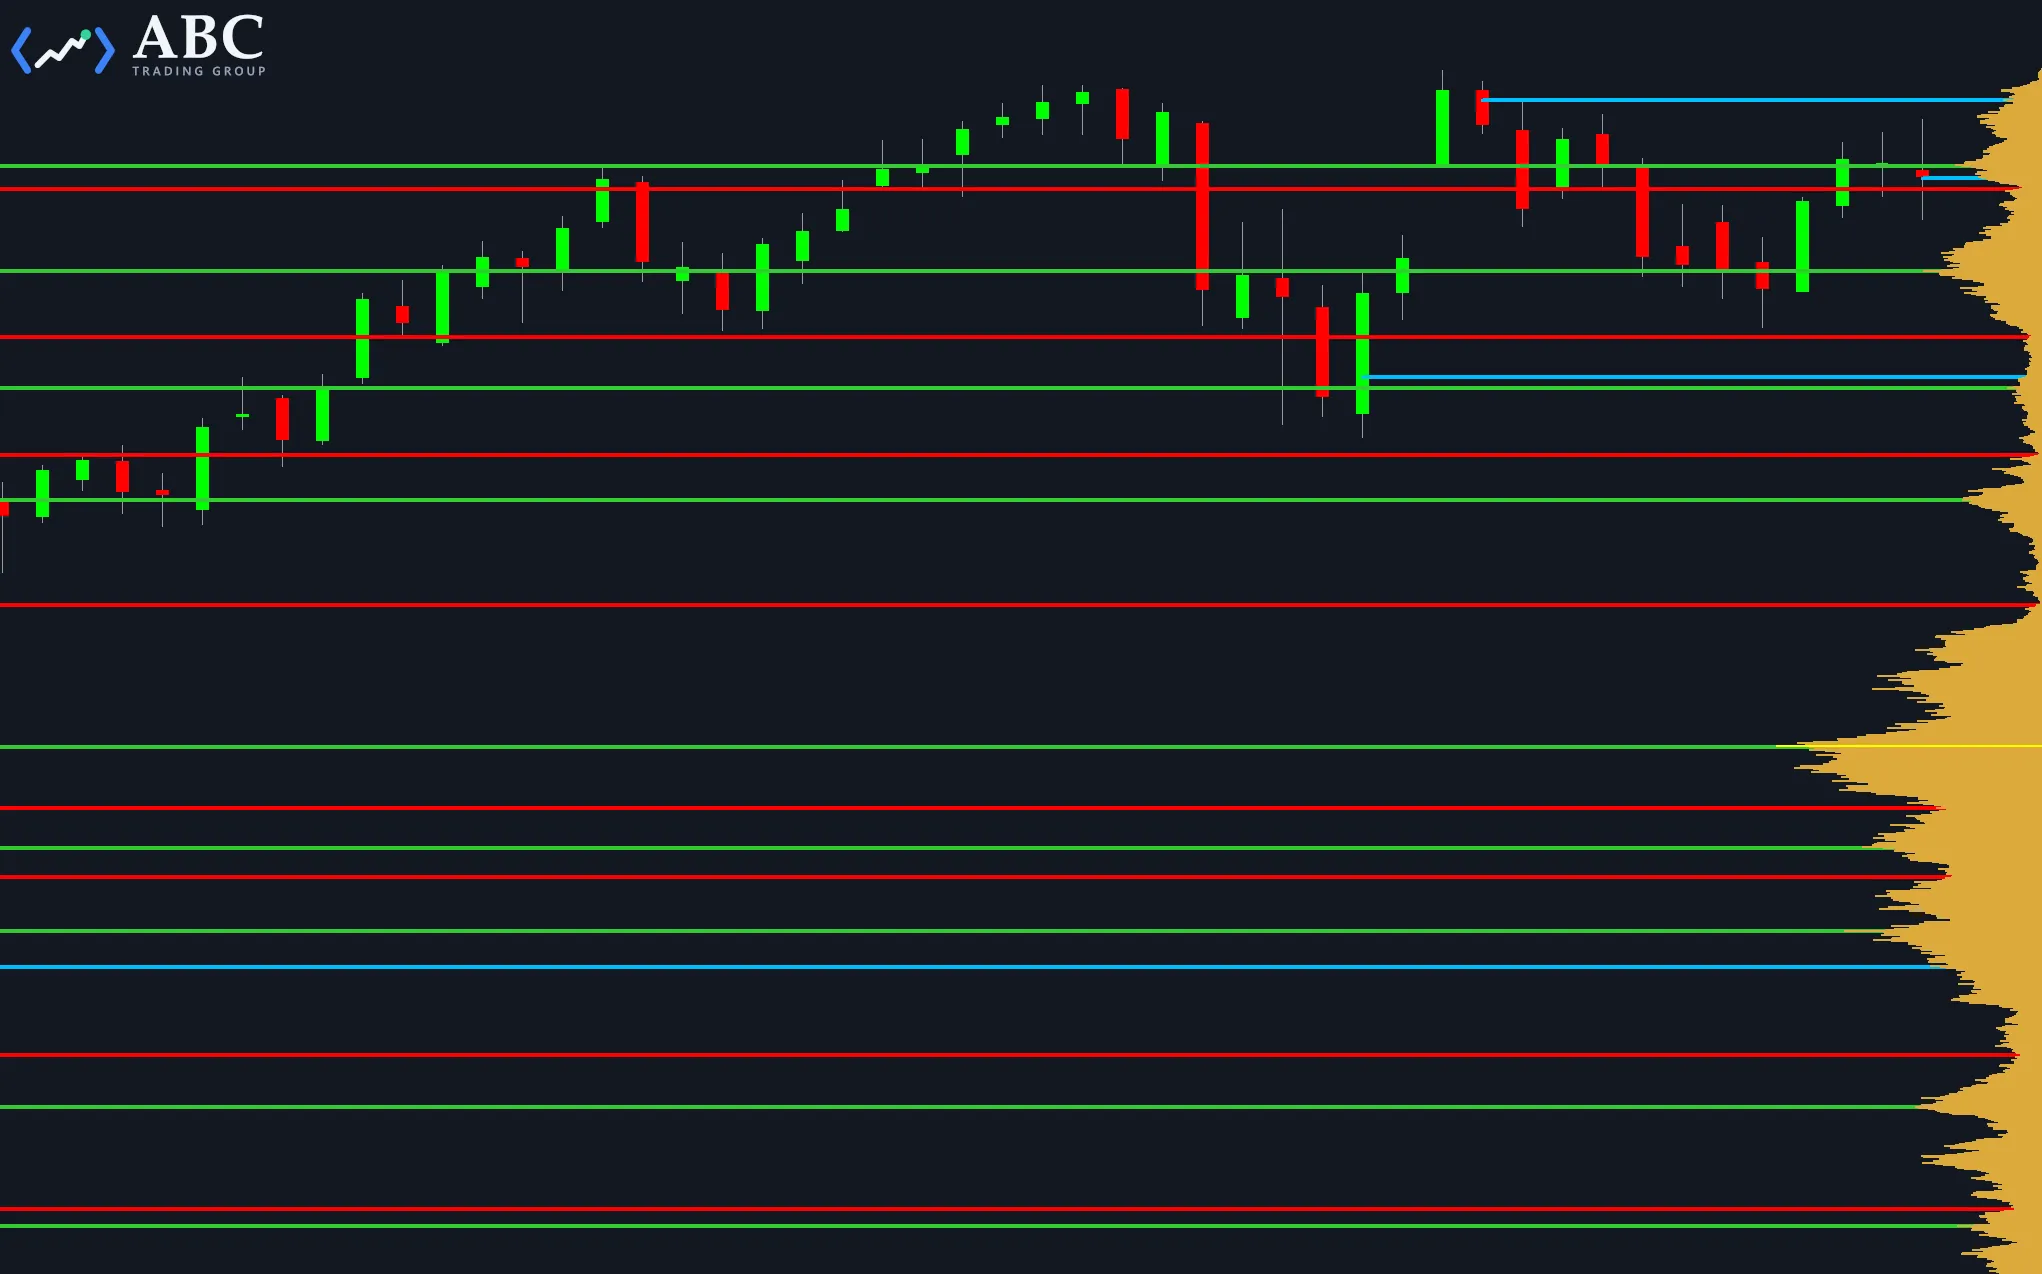
A proprietary trading desk needed long-term volume profiles in MultiCharts that show the volume actually traded at each price, without loading years of raw ticks into its charts. We built a PowerLanguage indicator that reads volume-at-price data from a local database.
Problems with building volume profiles
A volume profile shows how much volume traded at each price. In MultiCharts and TradeStation, a study sees each bar’s volume for the bar as a whole, not price by price. One workaround, which our free Value Area indicator uses, spreads that total evenly across the bar’s range. Accurate volume at each price, however, requires tick data.
MultiCharts’ built-in Volume Profile can load its own tick, minute, or daily data. Built from minute or daily bars, it is approximate; built from ticks, it is accurate, but a long-term profile then has to load years of tick data. For the client, loading that many ticks slowed profile generation and made long-term volume-at-price analysis hard to use.
What we developed
- Incoming ticks are converted into volume at each price and kept in an external database/cache, so charts don’t load raw ticks.
- Tick data from third-party vendors can be imported from text files, without loading it into MultiCharts.
- Stored volume can optionally be back-adjusted for futures rollovers.
- High- and low-volume nodes are detected automatically, and virgin nodes, including naked POCs, are tracked.
- Configurable alerts trigger as price approaches a node.
- Selecting an area of the chart groups the bars or sessions in it into one custom profile.
Results
- A rollover-adjusted profile built from several years of tick data, not estimated from bars, calculates in under a second on a mid-range PC.
- The desk reported more consistent volume-profile signals and clearer support/resistance levels with fewer false signals.
Deliverables
- PowerLanguage indicator
- External database/cache schema
- Deployment guide
- Sample workspace
- Alert examples
Can you develop a similar indicator for TradeStation?
Yes. EasyLanguage also gives a study each bar’s volume for the bar as a whole, so the same approach applies: build volume at price from tick data and store it in a local database. Keeping the volume-at-price data outside TradeStation avoids the platform’s limits on how many ticks a chart can load.
More on our EasyLanguage programming for TradeStation.