
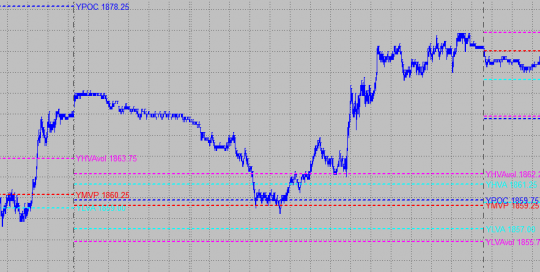
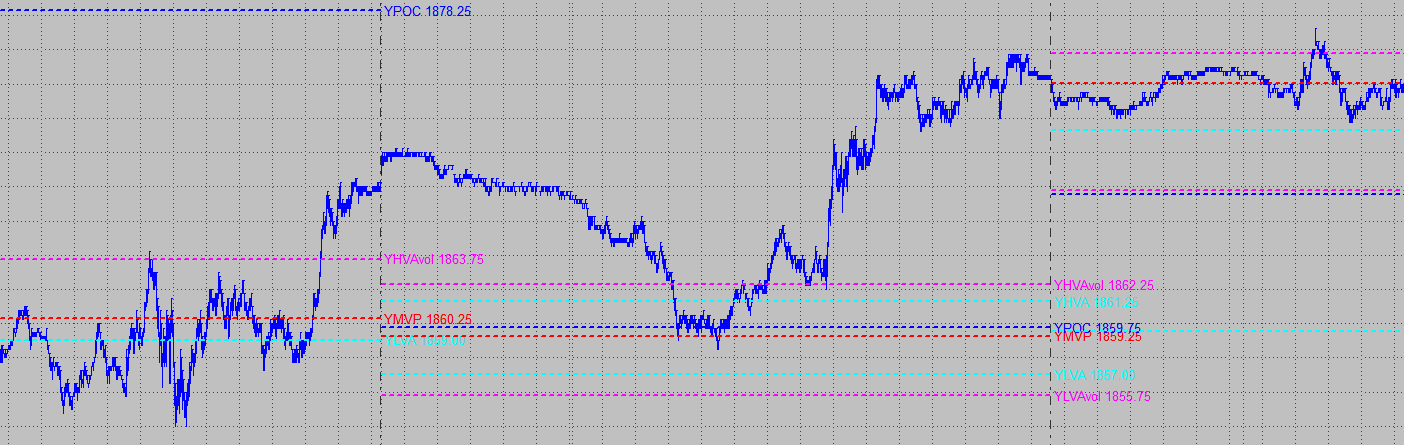
Volume and TPO Value Area Indicator and Function Latest Update: Version 1.04 - 2019-07-04 This indicator tracks the volume at each price and the Time Price Opportunity (TPO) count for the chart it is applied to. Based on this tracking it displays the price where the highest volume was traded and the price with the highest number of TPOs. These two values are called volume point of control (VPOC) and point of control (POC). The study also displays a value area around the VPOC and POC. The value area usually encompasses 70 % (roughly one standard deviation) of the [...]
TPO Chart Unstacked
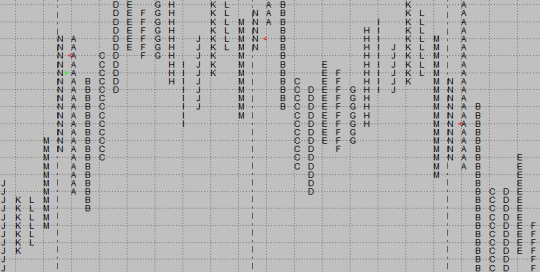
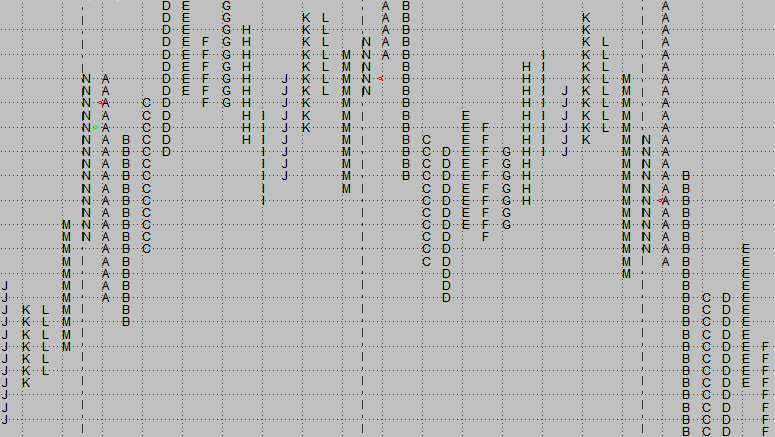
ABC2018-12-28T10:06:25+00:00Unstacked TPO Chart Indicator Latest Update: Version 1.02 - 2018-12-28 A TPO chart offer a different, yet powerful way for performing market analysis. You have probably seen the stacked version of a TPO chart albeit under a different name - Market Profile® [1]. It was developed by J.Peter Steidlmayer, a Chicago Board of Trade (CBOT) trader. You can find a lot of information including the Marketprofile Handbook at the CME educational websites. This indicator plots an unstacked TPO chart. TPO stands for Time-Price-Opportunity. The charts are constructed the following way. Each day is divided into equal time brackets. By [...]

Swing High Swing Low Text
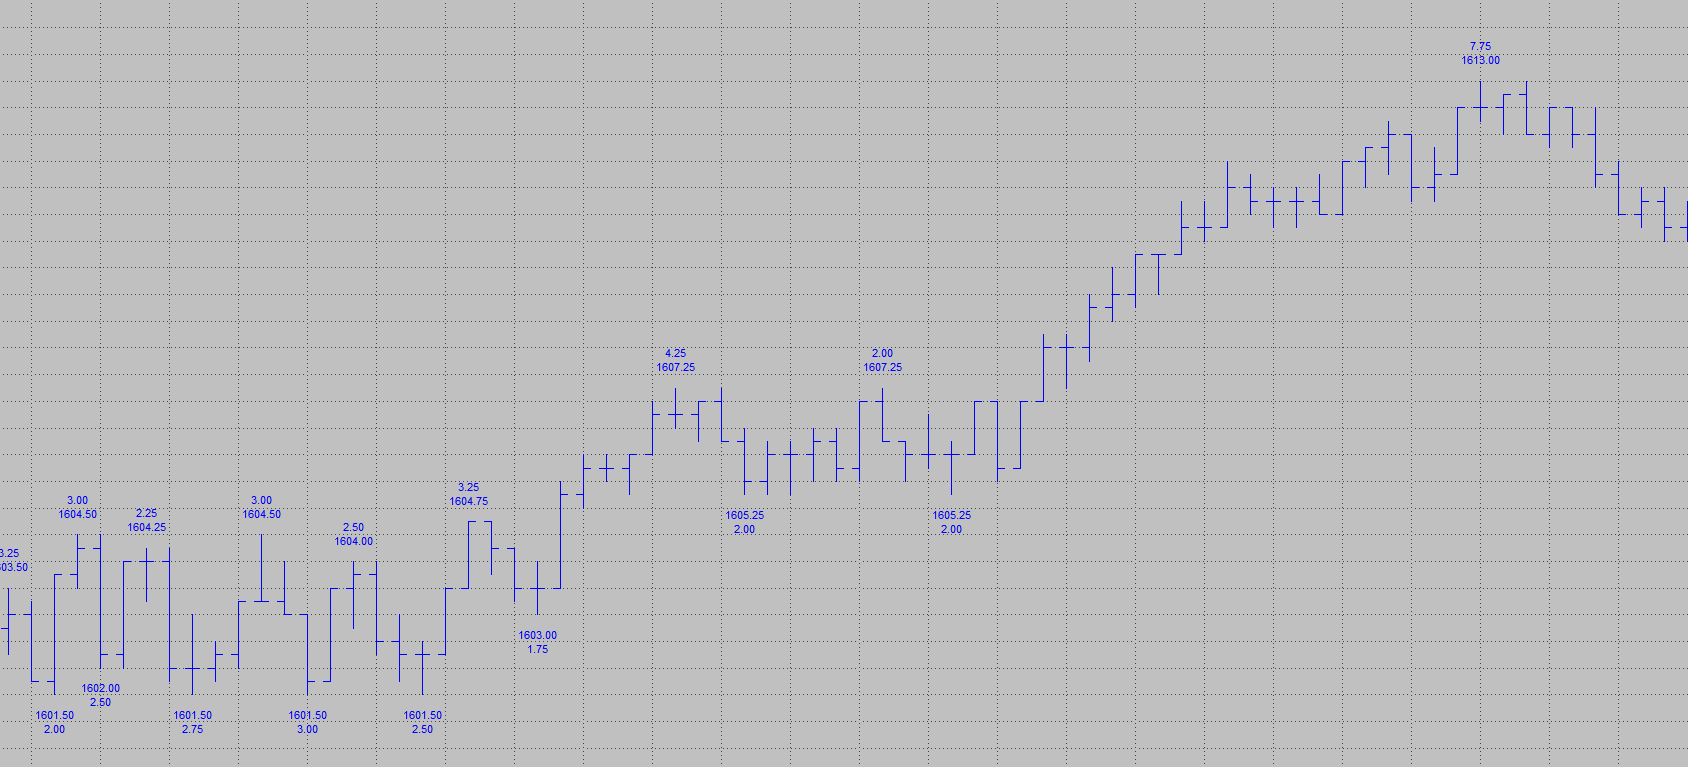
ABC2020-11-26T10:49:53+00:00Swing High Swing Low Text Latest Update: Version 1.04 - 2018-12-27 The study displays the high and low of the chart swing high and swing low based on a retracement ticks input. The file you can download will contain two versions of the indicator. One for Multicharts 32-bit and the other for the 64-bit version of Multicharts. If in doubt about the version you are using you can find this in the main program window under -> Help -> About Multicharts. The 32-bit version name will start with "MultiCharts Version" and the 64-bit version will display "MultiCharts64 Version" followed [...]

Midpoints Study
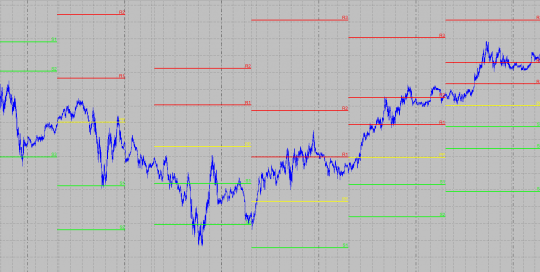
ABC2019-06-18T15:47:17+00:00Midpoints Study The Midpoints study tracks the extremes of the day or a custom session between a start and end time. Bases on the high and low extremes, three Midpoints are calculated: Daily Midpoint = ( Session High + Session Low ) / 2 Session Low Midpoint = ( Session Low + Daily Midpoint ) / 2 Session High Midpoint = ( Session High + Daily Midpoint ) / 2 The study comes with three color inputs and the plots change their color depending on the value of the bar close compared to the plot value. You can customize [...]
Floor Trader Pivots
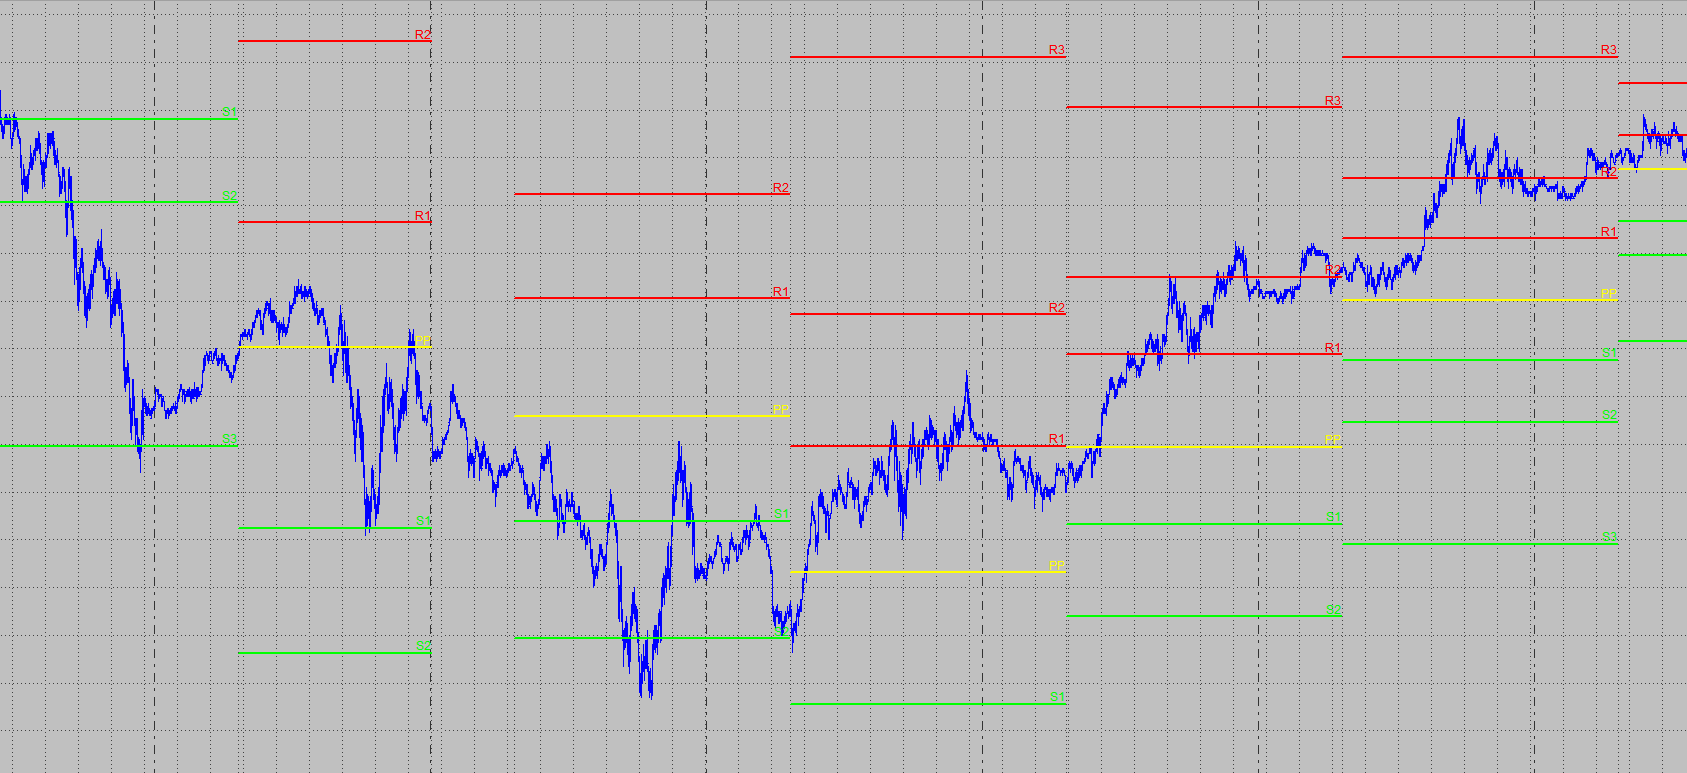
ABC2019-06-18T16:11:37+00:00Floor Trader Pivots Latest Update: Version 4.03 - 2018-12-27 In 2007 we posted the first revision of the ABC Floor Trader Pivots on the Multicharts forum. Since then it has spread widely across the internet, as many users have found it to be very useful and posted it to other forums, too. Pivot Points deliver support and resistance points based on previous day's market behavior. The Inputs to change the trendline appearance should be self-explanatory, they give you the ability to change the trendline style and size and the color for the support, resistance and Floor Trader Pivots lines. [...]