

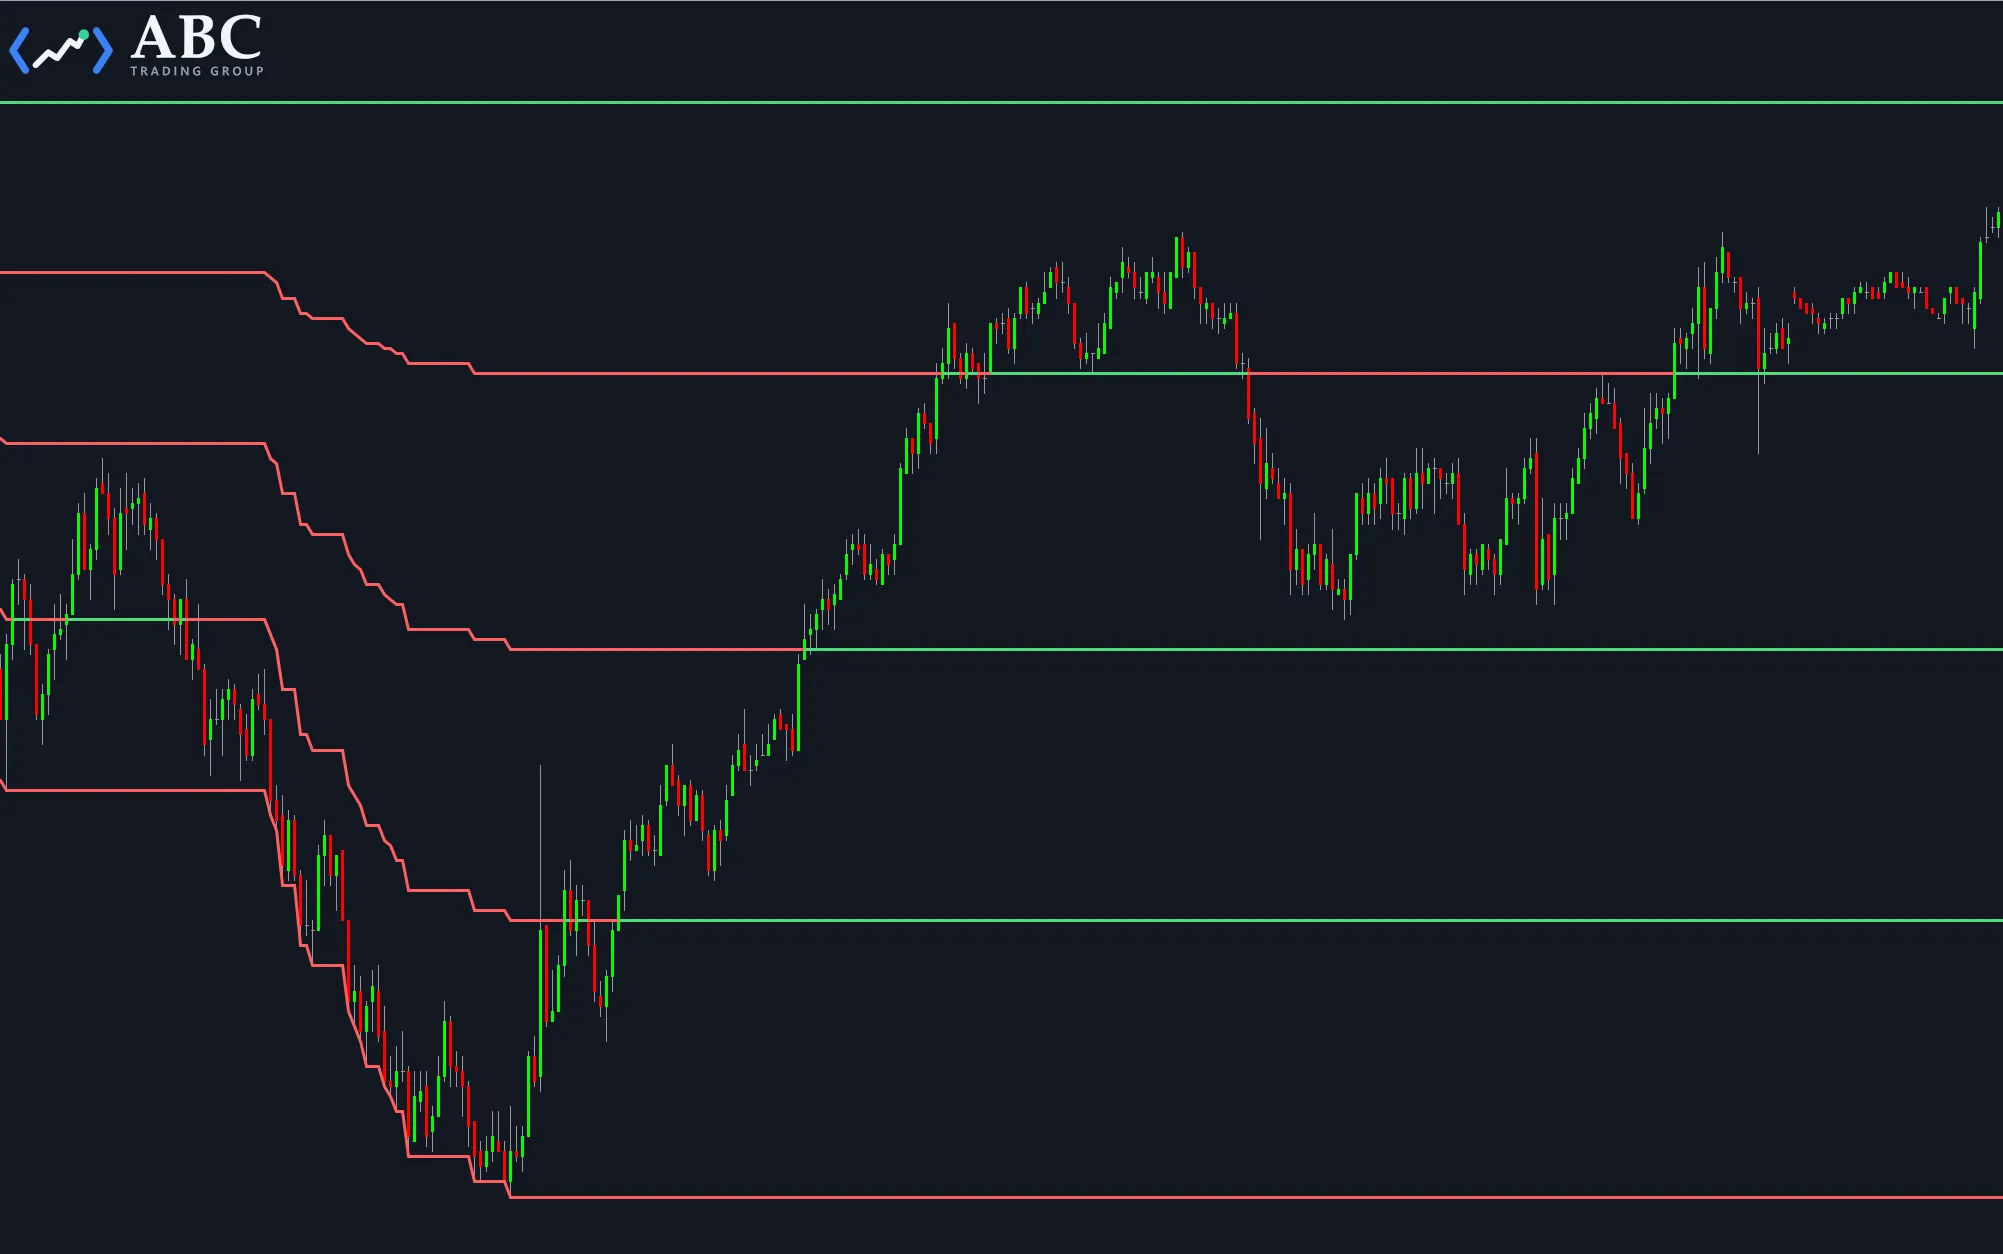
The Midpoints study tracks the extremes of the day, or of a custom session between a start and end time. Based on the high and low extremes, three Midpoints are calculated:
- Daily Midpoint = ( Session High + Session Low ) / 2
- Session Low Midpoint = ( Session Low + Daily Midpoint ) / 2
- Session High Midpoint = ( Session High + Daily Midpoint ) / 2
The study comes with three color inputs, and the plots change their color depending on the value of the bar close compared to the plot value. You can customize the output using the following inputs:
- UseTime – false = StartTime and EndTime will have no effect, and the High and Low will be tracked for the complete day. If the input is true, the High and Low will be tracked according to the StartTime/EndTime input settings only.
- StartTime – specifies the start time for the tracking in hhmmss format.
- EndTime – specifies the end time for the tracking in hhmmss format.
- UpColor – is used to color the specific plot, if Close > Plot Value.
- DnColor – sets the color that is used for a plot, in case Close < Plot Value.
- MatchColor – this color will be used for a plot, in case the close matches this plot’s value.
- Round2Tick – the study will round the MidPoints to the nearest tick if this input is true; if it’s false, the study will not round the MidPoints.
Overnight sessions and known limitations
The study was not designed to use a session spanning over two calendar days, like an overnight Globex session. In case you use the UseTime input and a StartTime later than the EndTime, you might run into problems. The study would need to be adapted to properly work on overnight sessions.