

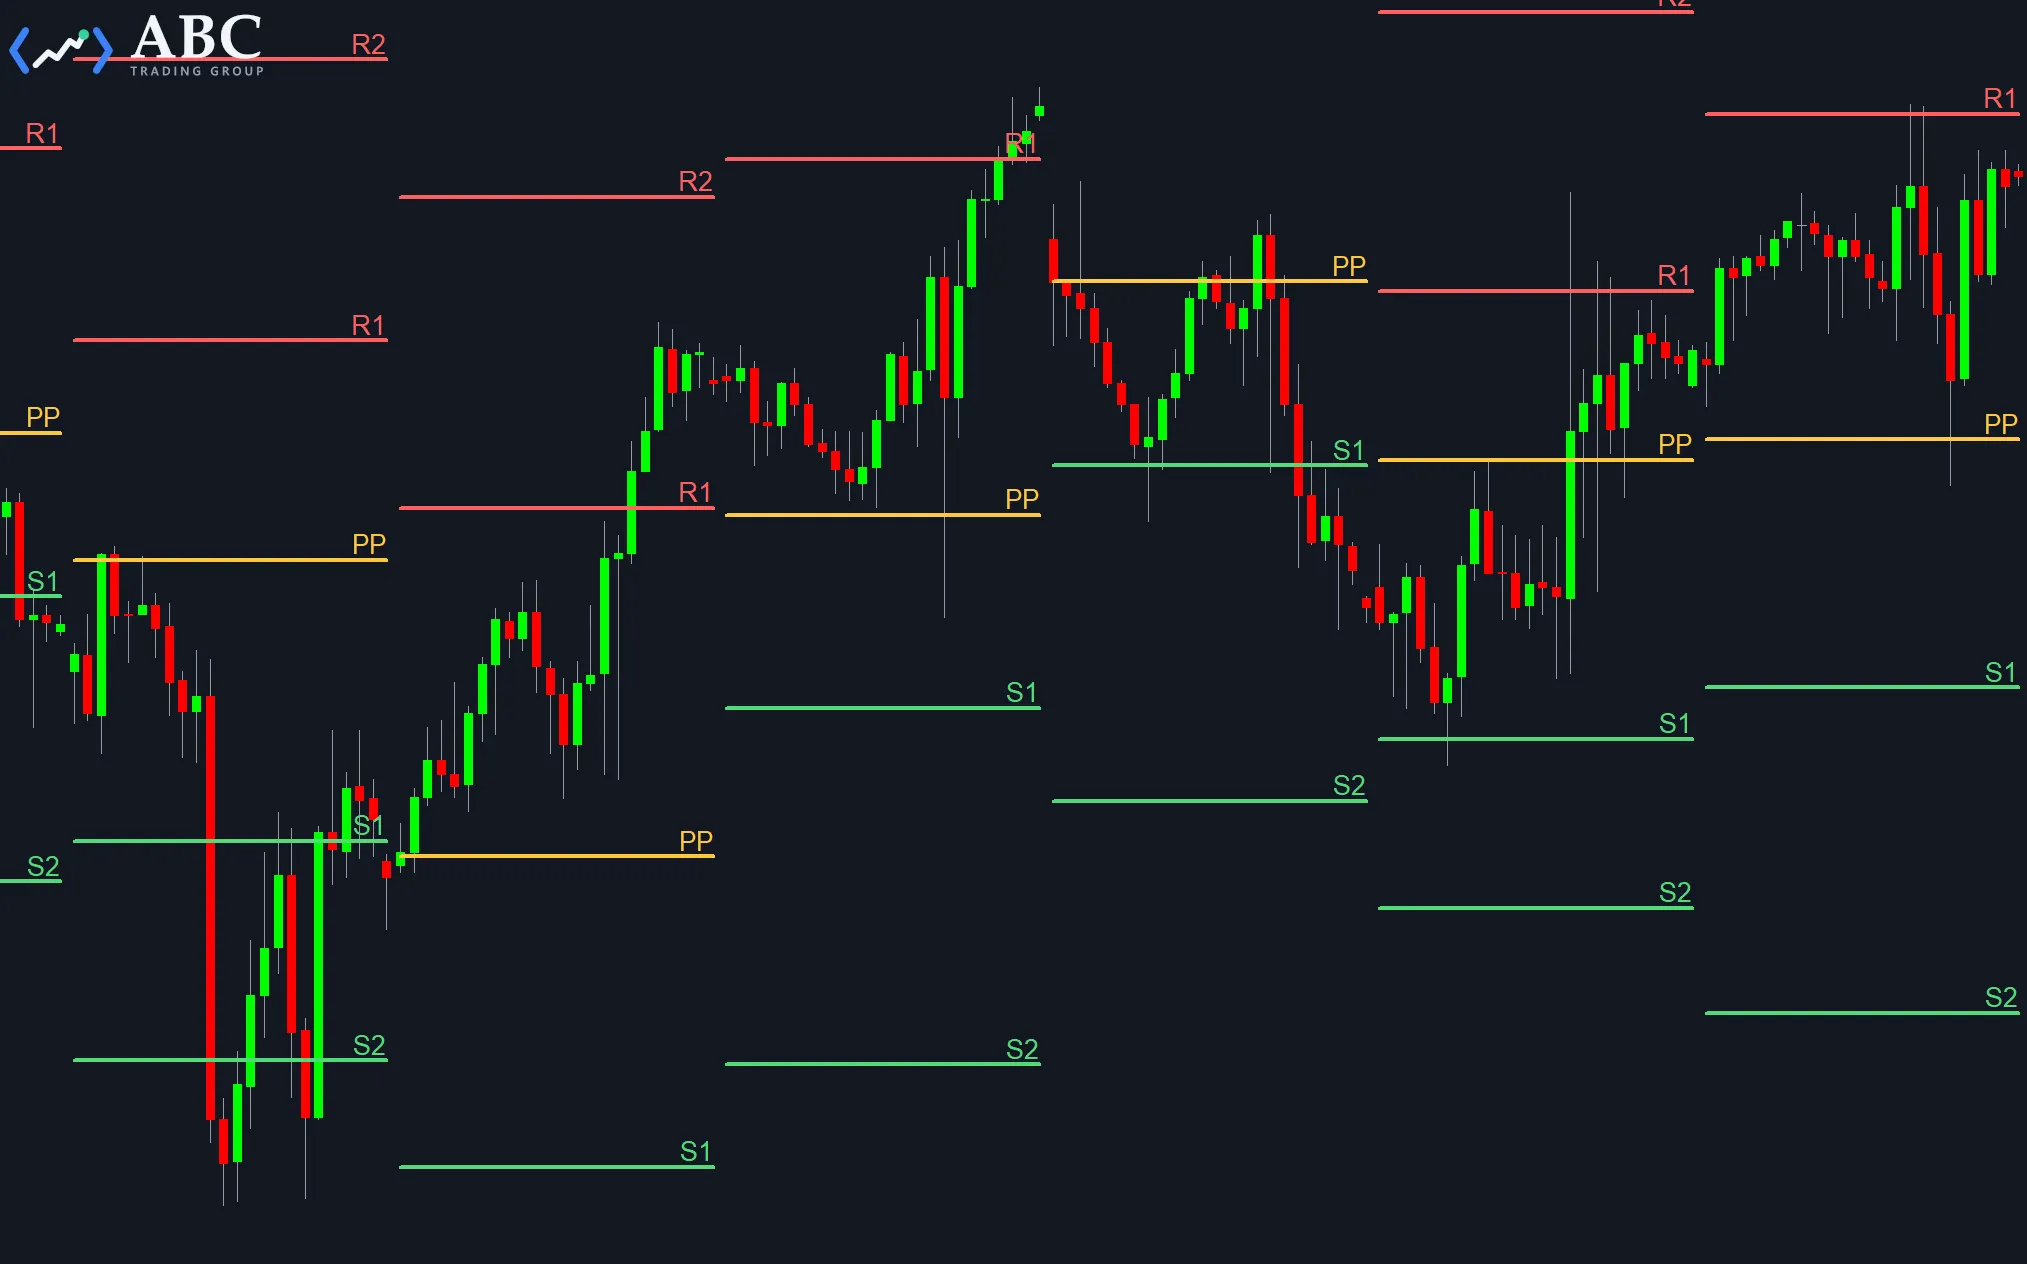
In 2007 we posted the first revision of the ABC Floor Trader Pivots on the MultiCharts forum. Since then it has spread widely across the internet, as many users have found it to be very useful and posted it to other forums, too.
Pivot Points deliver support and resistance points based on previous day’s market behavior. The Inputs to change the trendline appearance should be self-explanatory: they give you the ability to change the trendline style and size, and the color for the support, resistance and Floor Trader Pivots lines.
Additional inputs to customize the study
The additional inputs give you the flexibility to customize the outcome of the study to your needs:
- StartCalcTime – allows to set a start time to compute the pivots only for a specific time period (in hhmm format)
- EndCalcTime – allows to set the end time to correspond with the StartCalcTime input (in hhmm format)
You will notice that the Floor Trader Pivots can be quite different regarding the time brackets you use. The study was originally designed for the floor session only, but allows for sessions that span over two days, too. For example, the session starts on one day at 1700 and ends on the next day at 1600.
By setting either StartCalcTime or EndCalcTime to -1, the study will be computed on the full day, with resets at midnight.
- PlaceTextRight – this input gives you the possibility to switch the trendline labels from the end of the trendline (if the input is true), to the beginning of the trendlines (if “PlaceTextRight” is false)
- ExtendToRight – if enabled, the current trendlines will be extended to the right; otherwise they are updated until the last bar of the current period
- IgnoreWeekends – should be set to true if you are, for example, using E-Minis with the Globex session and want to see Monday’s pivots calculated with Friday’s values instead of Sunday’s. If you set this input to false, the study will treat the Sunday as a regular session.
- TextSize – sets the font size used for the text drawings
- FontName – sets the font to use for the text drawings
- LockDrawings – the “LockDrawings” inputs will lock the text and trendline to the chart so you can’t move them by mistake. In case you want to move one line, you can unlock it specifically with a right click on the drawing and selecting “Unlock Drawing”.
The remaining inputs are used to alter the trendline colors, style or size.