
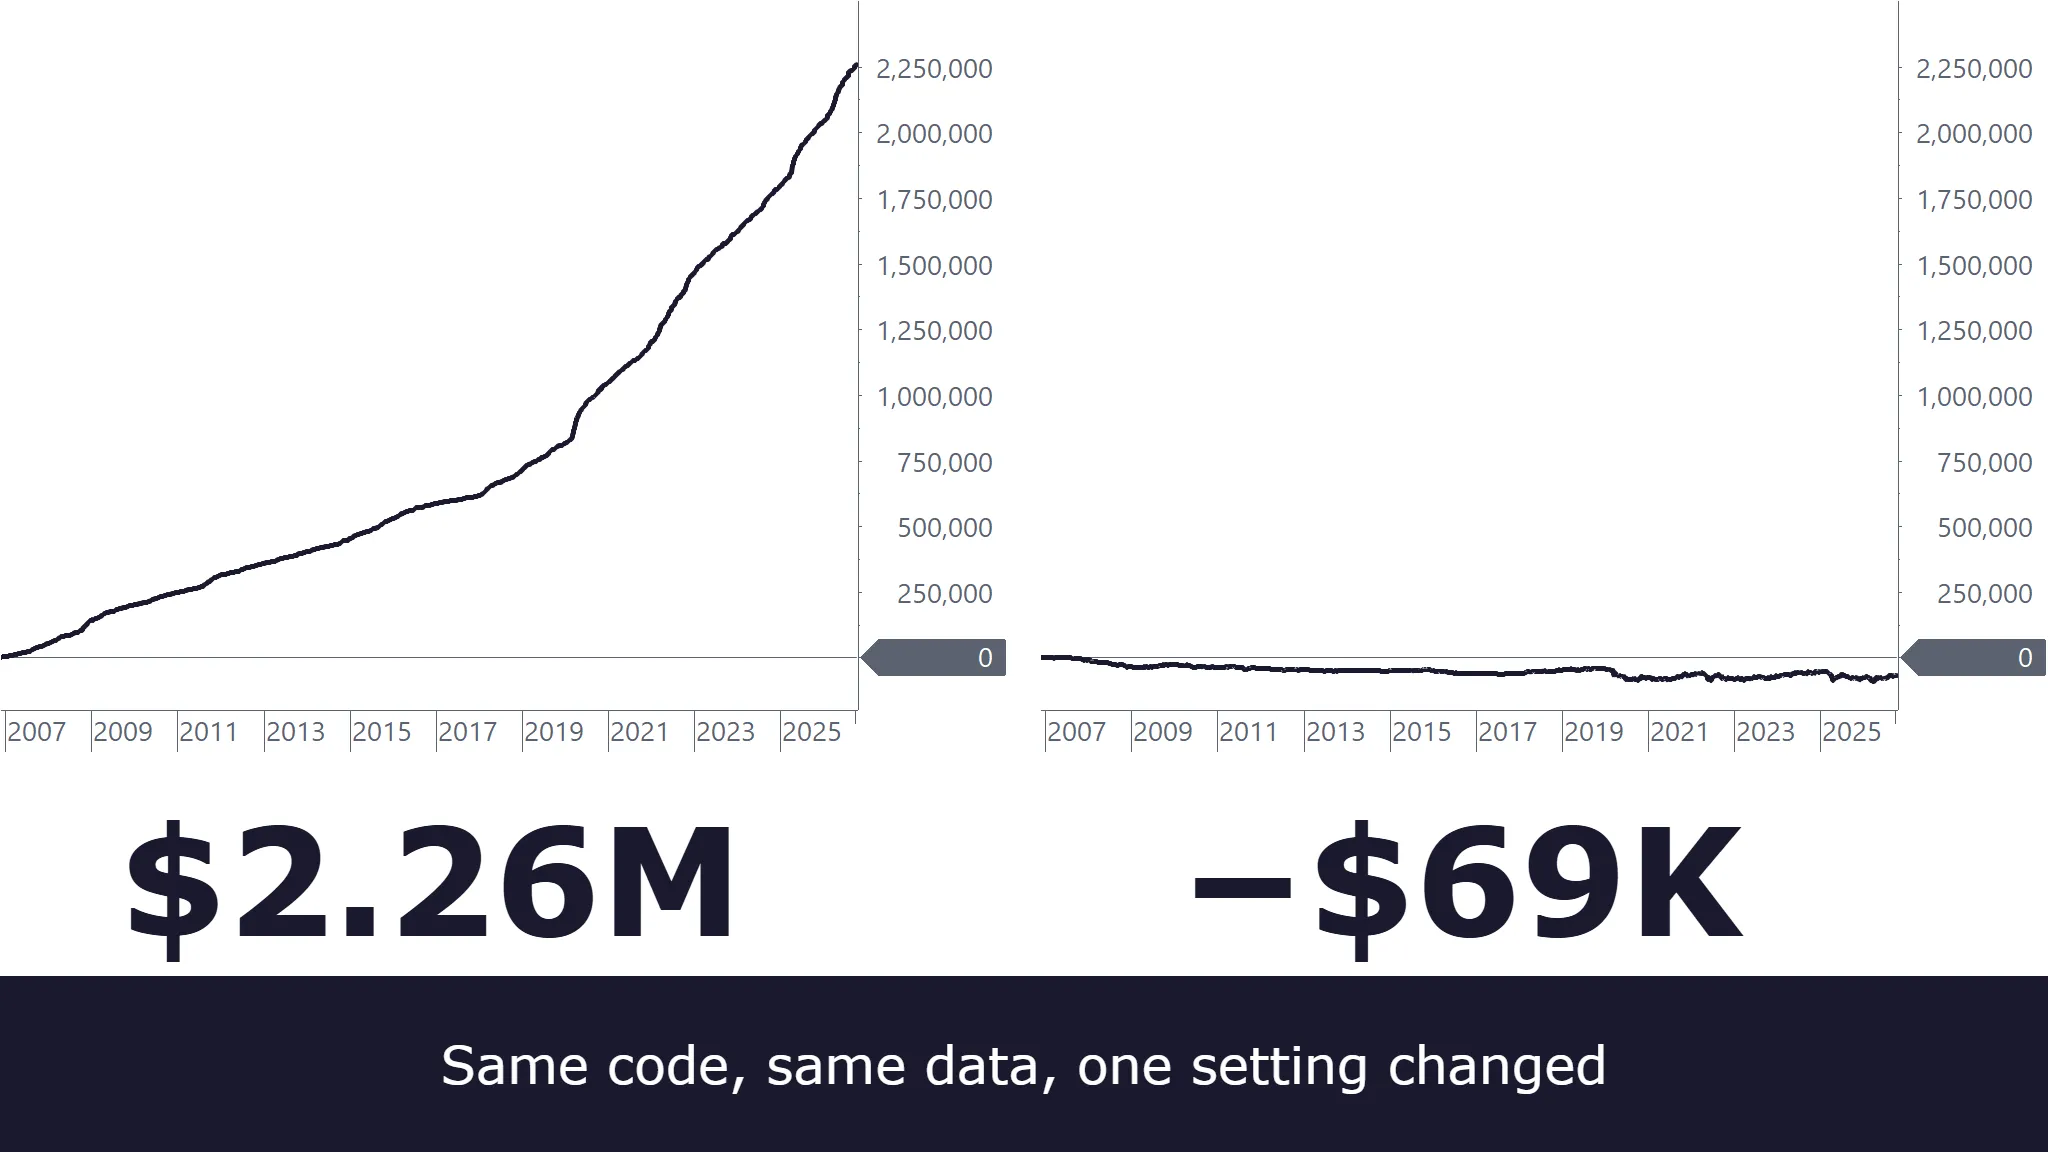
The same strategy, run twice on the same 20 years of E-mini S&P 500 data, made $2,258,340 in one backtest and lost $69,417.50 in the other. The code was identical, and nothing in it referenced a future bar. Only one platform setting was different.
That is look-ahead bias, a decision based on information that was not yet available. The forms you can search for, a negative offset or a lookahead flag, are covered in our articles on repainting and backtesting pitfalls. The forms covered here survive a code review because they hide in how the platform rebuilds history, how two data sources are lined up, and whether prices were adjusted for rolls or splits that came later. Each of them lets the code know something sooner than it could have known it live, and the checks below look for exactly that.
Key takeaways
- In a backtest, a second data series can already show how a bar will close at a moment when that bar would still be forming in real time.
- No line of the code looks ahead. In our example, a sensible-sounding rule read the current bar of a second symbol. At the close, that read was honest. During intrabar calculations on historical bars, it was not.
- A replay of part of the backtest period shows whether the backtest took trades a live run could not have taken. A log of what the code read shows why.
- A rule that almost never loses has earned more checks before it has earned capital.
- A check can expose a leak. No check can prove there is none.
Jump to: The example · How it read the future · What a code search finds · Two more leaks · Three checks · Checklist
One strategy, two backtests
The rule: buy the E-mini S&P 500 at market when the E-mini Nasdaq-100 is up more than 0.5 percent on the day, measured from its open, and exit at the close. The strategy trades the S&P contract on daily bars and reads the Nasdaq contract as a second data series on the same chart. The rule was chosen because it shows the effect cleanly, not because it is worth trading.
We ran it in MultiCharts from October 2006 to October 2026, trading one contract, with $55 per round turn for commission and slippage. Both markets used unadjusted continuous contracts, which keep the 0.5 percent threshold a true percentage. Every trade opens and closes within one session, so no trade spans a contract roll.
Each daily bar was built from one-minute data and runs from 17:00 Central time the evening before to 16:00. Bar Magnifier, which uses finer data to rebuild how each bar formed, was set to one minute in both runs. The only difference between the runs was intrabar order generation. This setting lets a strategy calculate and issue orders inside a bar instead of only at its close.
| Intrabar order generation on | Intrabar order generation off | |
|---|---|---|
| Net profit | $2,258,340.00 | −$69,417.50 |
| Trades | 1,702 | 1,701 |
| Winning trades | 95.8% | 50.1% |
| Maximum drawdown | −$15,575.00 | −$95,957.50 |
With intrabar order generation on, the strategy first calculates at the open. At that calculation, the Nasdaq bar it reads already shows the day’s final close. On a signal day, it buys at the open on a move the Nasdaq has not made yet, and sells at the close. The S&P usually moves with the Nasdaq, so on a day the Nasdaq closes more than half a percent above its open, the S&P nearly always closes above its own open too.
With the setting off, the strategy calculates once per bar, at the close, when the Nasdaq’s bar really is complete. The order fills at the next open and exits at that day’s close. That is the same decision, made at the close instead of the open, with information that existed when it was made. The counts differ by one because the last signal had no next bar to trade.
The second backtest acts with a one-bar delay, which is not what the first strategy would do in real time. Live, at the open, the Nasdaq’s bar has barely started, so the condition is almost never true at that moment. The rule would buy later in the day, whenever the Nasdaq actually crossed half a percent, a version we did not backtest. With the setting on, the strategy never had to wait.
How the first backtest read the future
A platform that calculates inside a bar has to rebuild how each historical bar formed, from its open, high, low, and close or from finer data. With intrabar order generation on, MultiCharts calculated each historical bar four times in our tests: at the open, at the nearer extreme, at the other extreme, and at the close. With Bar Magnifier at one minute, it calculated about 4,000 times per daily bar. The question is what the second series showed during those calculations.
We logged it with a test strategy that records, at the first calculation of each bar, what the code could read from the second series. The leak appeared on back-adjusted and unadjusted contracts alike. Realtime-History Matching, on or off, left the logs unchanged. Here are two days from the test using the Nasdaq as the second series and the data provider’s daily bars:
2026-07-06 1515 | calcs 4 | first calc: data1 status 0 close 7523.75 | data2 bar 2026-07-06 1515 status 2 close 29941.00 | final: data1 close 7591.50 data2 close 29941.00
2026-07-29 1515 | calcs 4 | first calc: data1 status 0 close 7464.00 | data2 bar 2026-07-29 1515 status 2 close 27342.00 | final: data1 close 7351.25 data2 close 27342.00
At the first calculation of July 6, the S&P bar still showed its open, 7,523.75. The Nasdaq bar with the same timestamp was already marked complete (status 2) at 29,941.00, its final close for the day. On all 58 days in this test, the Nasdaq bar already revealed its end-of-bar values at the S&P’s first calculation. On the live bar, the second series was still forming and showed the current price, so identical code read different values on history and in real time.
Each later test changed one thing from the first. The last column counts the bars on which the second series already revealed its end-of-bar values while the traded bar was still forming:
| Change from the first test | Calculations per bar | Second series final early |
|---|---|---|
| The first test: intrabar order generation on, no Bar Magnifier, S&P as both series, daily bars | 4 | 58 of 58 |
| Intrabar order generation off | 1, at the close | 0 of 58 |
| Bar Magnifier at one minute | about 4,000 | 58 of 58 |
| Nasdaq as the second series | 4 | 58 of 58 |
| Both series on 5-minute bars | 4 | 1,357 of 1,357 |
The finer resolution did not help. It refined only the traded series, but the second series’ bar was still finished at the first calculation. Changing the symbol or the bar size did not change it either. On 5-minute bars, every bar saw the other series’ bar with the same timestamp already finished. The traded series itself was rebuilt honestly: in a separate test over 4,509 five-minute bars, its first calculation always showed high, low, and close equal to the open. So the leak sits in the second series alone.
To test whether intrabar order generation itself caused the leak, we kept it on and read the Nasdaq’s previous bar instead. That reproduced the second backtest trade for trade, down to its −$69,417.50. The setting only exposed the leak. The Nasdaq series was where it entered.
It is a variant of the higher-timeframe leak in our repainting article, where code reads a higher-timeframe bar before it has closed. Here both series run on the same timeframe, and the alignment was correct without intrabar order generation.
Other platforms. TradeStation does not offer intrabar order generation on charts with more than one data stream, so this setup cannot be built there. A second symbol can still come in through a PriceSeriesProvider, and the editor warns when code that uses one also sets [IntrabarOrderGeneration = true]. A test we ran shows why: inside a historical bar, the provider returned its newest bar, a value from the end of the data, on every bar.
In NinjaTrader, our runs calculated once per historical bar, at its close, unless Tick Replay was on, and with Tick Replay both series stepped forward tick by tick, with the second series still forming at the first tick. We did not test MetaTrader 5 or TradingView for this case.
The guard. If a strategy reads a second symbol inside a bar, it has to read a bar that was complete at that moment. In TradeStation, read the provider only at the end of the bar, and only from a bar that is not later than the chart bar. In MultiCharts, a BarStatus(2) check is not enough on its own: in the log above, it already returned 2, the status of a complete bar, at the first calculation.
What a code search finds
Some look-ahead bias announces itself. A negative bar offset (in PowerLanguage, through Symbol_Close), barmerge.lookahead_on without an offset in a Pine Script request, a statistic computed over the whole history: search for them and you will find them. Our repainting article covers these future references, and our backtesting pitfalls article lists the classic forms of look-ahead bias, starting with a signal from a bar’s close that trades at that same close. In TradingView, calc_on_order_fills lets a strategy recalculate after a fill inside the same historical bar and exit at that bar’s high or low, one of the ways TradingView itself lists for a strategy to peek into the future. Search the code for it, and check the strategy’s properties too, because the same option can be switched on there.
The example had none of these. The code that reads the Nasdaq’s current bar is the same in a strategy that leaks and one that does not. On historical bars, the Nasdaq series always shows its end-of-bar values. A reviewer who knows what to look for can spot the leak: a second series read at its current bar while the strategy calculates inside historical bars. A keyword search cannot.
Two more leaks no keyword reveals
Mixed timestamp conventions
MultiCharts, TradeStation, and NinjaTrader timestamp a bar with its end time. MetaTrader 5 timestamps it with its start (MqlRates.time is the period’s start time), and in Pine Script time is the bar’s open, with time_close for its close.
Import intraday bars timestamped with their start time as a second data series into a platform that uses the end time, and every imported bar moves one bar earlier than the platform’s own data. The hourly bar that ran from 10:00 to 11:00 arrives timestamped 10:00, next to the platform’s own bar from 9:00 to 10:00, so the strategy reads the 11:00 close at 10:00: one bar of look-ahead, created by the import. Imported from a platform that uses the end time into one that uses the start time, every bar arrives one bar late. Which time zone a timestamp is in is a separate question, covered in our article on sessions, time zones, and DST.
Prices adjusted after the fact
Back-adjusted futures and split-adjusted stocks carry later events into earlier prices, so a rule that tests a fixed price level decides on something that had not happened yet. On difference-back-adjusted futures, percentages depend on those later events too, as our pitfalls article explains.
Three checks for look-ahead bias
1. Check whether the trades and results fit the rule
The first backtest won 95.8% of 1,702 trades, and every entry was filled at the day’s opening price. The rule needs the Nasdaq to be up half a percent from its open, but at the open it has barely moved. A trade list like that has earned the next two checks before anything else. Where it is less obvious, take a few winning trades and check on a finer chart whether the condition was really true when the order went in.
2. Compare the backtest with a replay of the same days
Replay part of the backtest period at the same intrabar resolution and compare the trades. The strategy, its settings, and its bars stay the same. The only difference is how the data arrives. The replay plays it back in the order it happened, while the backtest starts from finished bars and rebuilds how they formed. If the code uses only information that was available at each moment, they should differ only a little, with no consistent direction. Differences that consistently favor the backtest, such as earlier entries, better prices, or losing trades only the replay took, mean the backtest saw something the replay could not.
We replayed 2026 through October 2 in MultiCharts’ Simulated Trading at one-minute resolution. The backtest traded 70 times in that period, every time at the open, won 68 of those trades, and made $218,650. The replay took 128 trades, none of them at the open, won 69, and made $18,572.50 in total. On the days both traded, the exits matched, and the replay bought later and higher every time. Its other 58 trades came on days the Nasdaq rose past half a percent and then closed below it. Together, they lost $117,627.50. The backtest never took them, because at the open it already knew how the day would end.
For this comparison, build the backtest’s bars the way the replay builds them. For daily bars, that means building them from minute data with the same session times, as we did. A data provider’s daily bars can close at the settlement price and fold holiday sessions into the next day, and either difference changes trades without any leak.
Play the data back at a speed the platform can keep up with, and check this with a log. In our replays that kept up, the strategy calculated about once for each one-minute bar of the two symbols. At top speed, it calculated about half as often, and the two series fell out of sync. At most signals, the Nasdaq series was ahead of the S&P, typically by about an hour and a half.
3. Log what the code read
Log whenever the strategy issues an order. Print the value the code read, the timestamp of the bar it came from, and that bar’s status. Then compare the log with the actual prices at that moment, on a finer chart, in a replay, or in a live run. The log in the example shows what to look for: at the S&P’s first calculation of July 6, the Nasdaq bar was already finished. A value that could not have been available when the code read it is look-ahead bias, whatever the profit says.
Before you trade it
- Any near-perfect win rate or suspicious entry price in the trade list has been explained
- A replay of part of the backtest period, with bars built the same way, the same intrabar resolution, and a playback speed the platform keeps up with, shows no differences that consistently favor the backtest
- A log of what the code read, with each bar’s timestamp and status, shows only values that were available at that moment
- Inside a bar, a second symbol is read only from bars that were complete at that moment, and compiler warnings about intrabar reads are heeded
- Imported data uses the same timestamp convention as the platform it is loaded into
- Rules that test a fixed price level run on unadjusted prices, and no percentage is computed on difference-back-adjusted futures prices
The common thread
Every leak here is about when the code is allowed to know something, and none of them is written in the code. Each one comes from the way the platform rebuilds historical bars, a timestamp convention, or an adjustment made to the prices before the code ran. That is why reading the code alone does not find them. Compare the backtest with a replay, log what the code read, and check the data before it goes in. A result that survives has passed one more test. A result that vanishes stays suspect until the log explains why.
If you would rather have these checks run against your own strategy, that is part of our AI code review and strategy validation work.
Frequently asked questions
Is look-ahead bias the same as repainting?
No, though they overlap. Repainting means a value on a closed bar changes after the fact. Look-ahead bias means a decision uses information that was not available when it was made. Repainting becomes look-ahead bias when a backtest can read the final, repainted value. The leaks in this article need no repainting at all.
Does a finer backtest resolution prevent it?
Not in our tests. Bar Magnifier at one minute rebuilt the traded series in far more detail, about 4,000 calculations per daily bar, and the second series was already finished at the first of them on every day tested. Finer data improves the simulation of the series it is applied to. It does not change what the other series shows.
Does out-of-sample or walk-forward testing catch it?
Not the leaks in this article. They come from the way the platform rebuilds historical bars or from the data, and the out-of-sample period and every walk-forward window share both. So a leaked result can pass either test. Out-of-sample testing checks for a different problem, overfitting.
Comparing the backtest with a replay of the same days, or with the strategy run forward in real time, can expose a leak, and so can a log of what the code read.
This post is for educational purposes and is not trading advice. The strategy in it is an illustration, and its results are hypothetical. See our risk disclaimer for the full statement on simulated performance.