
Floor Trader Pivots
Latest Update:
Version 4.03 – 2018-12-27
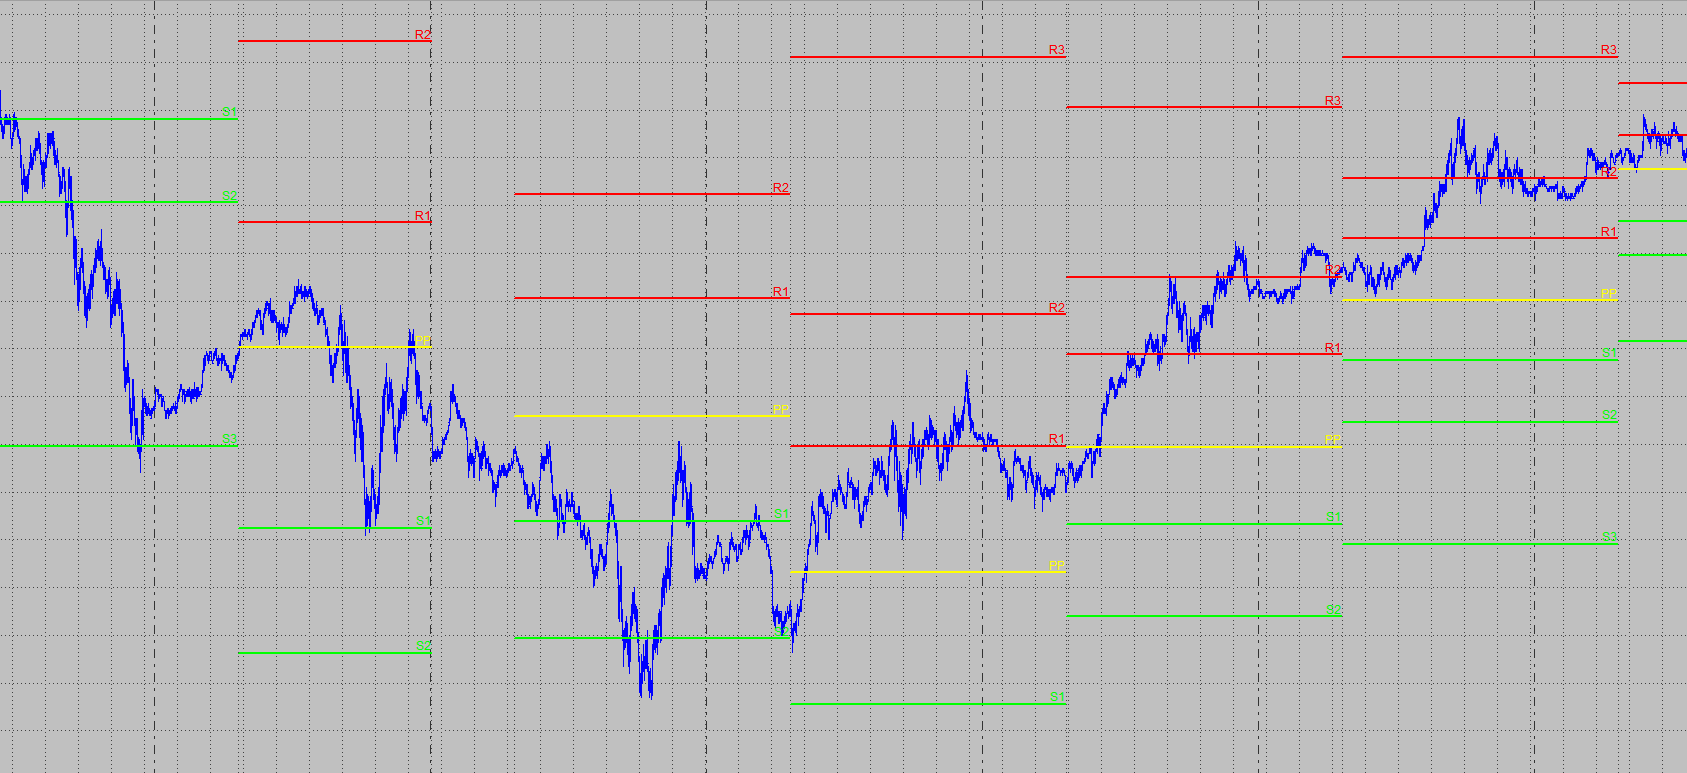
In 2007 we posted the first revision of the ABC Floor Trader Pivots on the Multicharts forum. Since then it has spread widely across the internet, as many users have found it to be very useful and posted it to other forums, too. Pivot Points deliver support and resistance points based on previous day’s market behavior.
The Inputs to change the trendline appearance should be self-explanatory, they give you the ability to change the trendline style and size and the color for the support, resistance and Floor Trader Pivots lines.
The additional inputs give you the flexibility to customize the outcome of the study to your needs:
- StartCalcTime – allows to set a start time to compute the pivots only for a specific time period (in hhmm format)
- EndCalcTime – allows to set the end time to correspond with the StartCalcTime input (in hhmm format)
You will notice that the Floor Trader Pivots can be quite different regarding the time brackets you use. The study was originally designed for the floor session only, but allows for sessions that span over two days, too (the session starts on one day at 1700 for example and ends on the next day at 1600 for example). By setting either StartCalcTime or EndCalcTime to -1 the study will be computed on the full day, with resets at midnight.
- PlaceTextRight – this input gives you the possibility to switch the trendline labels from the end of the trendline (if the input is true), to the beginning of the trendlines (if “PlaceTextRight” is false)
- ExtendToRight – if enabled the current trendlines will be extended to the right, otherwise they are updated until the last bar of the current period
- IgnoreWeekends – should be set to true if you are for example using E-Minis with the Globex session and want to see Monday’s pivots calculated with Friday’s values instead of Sunday’s; if you set this input to false, the study will treat the Sunday as a regular session.
- LockDrawings – the “LockDrawings” inputs will lock the text and trendline to the chart so you can’t move them by mistake; in case you want to move one line you can unlock it specifically with a right click on the drawing and selecting “Unlock Drawing”.
The remaining inputs are used to alter the trendline colors, style or size.
To receive your free copy for any of our tools simply subscribe to our mailing list. Besides that you will receive free updates and new free tools as soon as they are available. Upon subscription you will receive a mail with a confirmation link to your inbox. Follow the information provided in this mail and you will be able to download a free copy of each tool within seconds. This tool will work with Multicharts 9 and higher, it might not work in earlier versions and it won’t work in Multicharts.NET.
We highly value your privacy and we will never sell or share your information. In case you no longer want to receive information and tools from us for free, we have made unsubscribing easy for you with a link in every mail.
trading is best way of earning
thank you
Can I use this in multicharts.net? I can only import .pln files. Please help
James, this code won’t work in Multicharts.NET as it is for the PowerLanguage version of Multicharts. Code is not compatible between the two versions of Multicharts.
Thanks for the reply. Is there a way to convert?
James, the indicator would have to be re-written in C# for Multicharts.NET as there is no easy way to convert it.
It is for which version of multicharts ?
Hi Peterson,
the Floor Traders indicator is for the regular version of Multicharts, it won’t work in Multichart.NET.
Regards,
ABC
I use multicharts 9.1, but I can not import the bookmark. Gives a message that it is not compatible
Peterson,
the code was exported using the latest official release (at the time of the export this was Multicharts 10). Unfortunately Multicharts won’t import studies that were exported using a newer version of Multicharts. To be able to import the studies, please update your version of Multicharts to the current official release version.
Regards,
ABC
Hello, I tried to download, but I did not open the link.
Hi Peterson,
our records show that you successfully subscribed to the download list. This will automatically send you the links with an email. In case you did not receive the email, please check your spam folders. To import the tools into Multicharts, please follow the instructions in the mail.
Regards,
ABC
Hi, thank you for providing this indicator. I’m trying to use it on two different time interval charts for the same instruments (e.g., e-mini), but it gives me different values for the 5 min chart vs the 1 hr chart. All of the inputs are the same for the two charts, the instruments are formatted the same, etc. What could be causing the discrepancy? Thank you.
Hi Tim,
thank you for your comment. This could be caused by different data that the indicator has access to. For example an hourly bar might only start at the full hour, which would make it not possible to start
the pivot tracking at a time within the bar (930 for example), as the code only has access to the ending time stamps of the bars.
Regards,
ABC
It will be a much better pivot points indicator if you could also bring in midpoints like M0, M1,M2,M3,M4,M5
Hi Anees,
thank you for your feedback. You point want to take a look at the midpoints indicator, that might be able to do what you have in mind.
Regards,
ABC
I did review the midpoint study indicator and its not quite the one I referred above. This indicator only has daily midpoint, session high midpoint and session low midpoint. My request is to see if you can just enhance the existing pivot point indicator to include pivot point midpoints like M0, M1,M2,M3,M4,M5
Hi Anees,
how exactly would M0, M1 etc. be computed? We might consider the addition for a future update, but please feel free to contact us directly in case you are interested in a custom coding project.
Regards,
ABC
Hello,
You may use the below formulas for the midpoints.
Resistance 3 = High + 2 * (Pivot – Low)
Midpoint M5 = (Resistance 3 + Resistance 2) / 2
Resistance 2 = Pivot +(R1 – S1)
Midpoint M4 = (Resistance 2 + Resistance 1) / 2
Resistance 1 = 2 * (Pivot – Low)
Midpoint M3 = (Resistance 1 + Pivot Point) / 2
Pivot Point = (High + Close + Low) / 3
Midpoint M2 = (Pivot Point + Support 1) / 2
Support 1 = 2 * Pivot Point – High
Midpoint M1 = (Support 1 + Support 2) / 2
Support 2 = Pivot – (Resistance 1 – Support 1)
Midpoint M0 = (Support 2 + Support 3) / 2
Support 3 = Low – 2 * (High – Pivot Point)
Also it will be great if this pivot point indicator along with the midpoints I have requested can be enhanced as a Weekly, Monthly and Yearly Indicator. The formulas remain the same. Just the period needs to be changed. It will be an awesome indicator to have. Hope you can help traders like me.
I tried downloading the Floor Traders Pivots and it tells me to subscribe, I did and confirmed subscription but no download. Not sure if its a browser issue, I used both Firefox and chrome. If you can please email me the file
Hi Richard,
thank you for your message. The mail with the links was sent to you following your subscription, but sometimes the Email with the download links is placed in the Gmail Spam or Promotion folders. Please check if this is the case for you, too. You might have to login into your account to see those special folders.
Regards,
ABC